

When something is obvious, always be ready for the opposite, warns Al Brooks.
The E-mini S&P 500 futures has rallied strongly for two weeks. It might gap up again this week. Traders expect a new all-time high early this week, and they will buy the first one- to three-day pullback.
5th consecutive bull month and rare gap up
The monthly S&P500 E-mini futures chart gapped up in August (see chart below). Gaps on the monthly chart are rare. The gap was small and small gaps are typically not especially important.
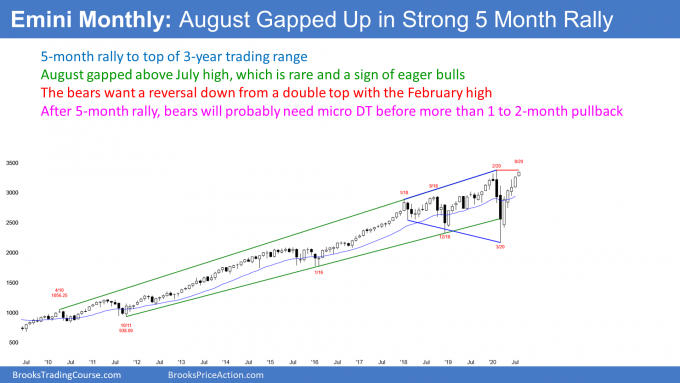
August is forming its fifth consecutive bull bar since reversing up from a 10-year bull trend line in March. We are in the early stages of August and the month could be very different once it closes. However, the momentum up has been good. Traders will probably buy the first one- to two-month pullback.
Will the E-mini break solidly above the February high?
Can the bulls break far above the February high in August? Of course, but strong rallies usually have some profit taking around major resistance. The February high is an obvious possibility. But if August closes on the high of the month and far above the July high, traders will expect higher prices in September.
What happens if August reverses down and closes on its low? It would be a sell signal bar for September for a double top with the February high. However, after four strong months, the first reversal will probably be minor. Many bulls did not buy the rally and have been waiting for a pullback. That will probably limit the selling to a month or two.
After a pullback, will the E-mini break far above the February high? It is more likely that a one-month pullback will lead to a micro double top with the August high and at least another sideways month. At that point, traders will decide between a micro double top with the August high or a small bull flag and a resumption up of the bull trend.
Accelerating up after gapping up this week
The weekly E-mini chart gapped up last week (see below). Since there was a gap down in February, there is now a four-month island bottom. The bulls are hoping that traders will see this as a sign of strength and encourage them to buy at the high.
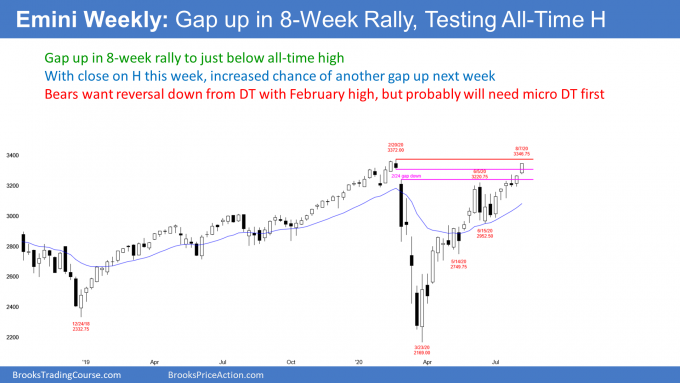
Three of the past five weeks gapped up. The first two closed, but last week’s gap up stayed open. With it closing on its high, there is an increased chance of a gap up again this week. There is a small chance of a gap above the February all-time high.
There is now a six-week bull micro channel. That means the low of every bar was above the low of the prior bar for five weeks. That is an additional sign of strength and it further increases the chance of higher prices this week.
Also, even if next week pulls back, with this much momentum, traders expect that buyers will soon come in. Consequently, even if there is a reversal down at the February high, the first attempt down will probably only last a week or two. The bears will likely need at least a micro double top before they can get a pullback lasting more than two weeks.
8 consecutive bull days unsustainable and therefore a buy climax
The daily E-mini chart has had eight consecutive bull days. This is unusual and therefore unsustainable and climactic (see chart below).
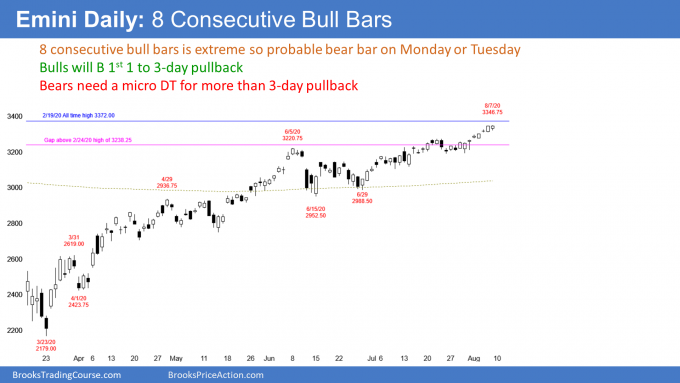
While this is a sign of strong bulls, a similar rally up to the June 5 high reversed down 9% over the next five days. However, the bears will probably need a micro double top before they can get more than a one- to -three-day pullback. Traders expect a new all-time high next week.
When something is obvious, always be ready for the opposite
It is important to note that when there is a good chance of something bullish happening, the trade might be crowded. That means that everyone wanting to buy is already long and there is no one left to buy next week.
Consequently, whenever something seems likely, there is an increased chance of the opposite happening. For example, instead of rally strongly to a new high on Monday or Tuesday, the E-mini might sell off sharply like it did in June.
Trading Room
Traders can see the end of the day bar-by-bar price action report by signing up for free at BrooksPriceAction.com. I talk about the detailed E-mini price action real-time throughout the day in the BrooksPriceAction.com trading room. We offer a two-day free trial.


