

The euro rally is a buy climax so traders should expect a correction to recent support levels, reports Al Brooks.
For the EURUSD currency pair, August will probably show a bull body on the monthly chart and be a good follow-through month. The EURUSD might trade a little higher in the next week or two, but the wedge rally on the weekly chart will probably lead to a test down at some point in September.
The EURUSD is trading far enough above the open of the month so that August should have a bull body (this as written on Aug. 30). July was a big bull bar. This month is the follow-through bar after that breakout (see chart below). Follow-through bars are important because they often give a clue of what to expect in the next month.
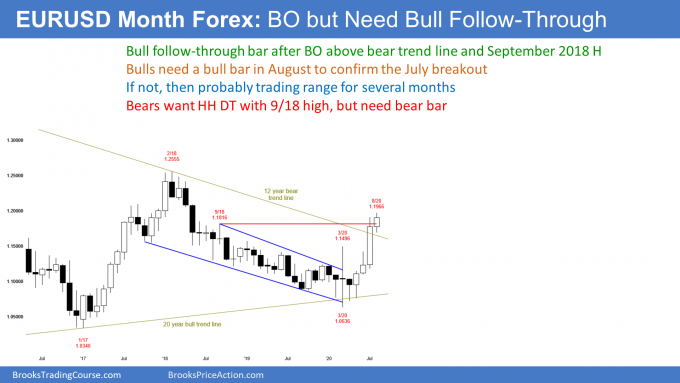
If August were to be a big bull bar closing near its high, traders would expect a test of the February 2018 high by the end of the year. If August was a big bar closing on its low, traders would conclude that the July breakout would fail. They would look for a reversal down, possibly to the March low.
Neither of these extremes is likely. Traders expect August to probably have a small bull body. There is a 20% chance of a big selloff on Monday and August ending up with a bear body.
If it has a bull body, traders would see that as confirmation of the July breakout. That would increase the chance of at least slightly higher prices in September. Or, if there is a test down in September, they would expect a test back up within a month or two.
Pullback in Spike and Channel Bear Trend
The two-year selloff was a Spike and Channel Bear Trend. For the past year, I have said that there would be a rally to the September 2018 high. This is because that was the start of the channel phase of the pattern, and that is always a magnet.
Once there, the chart usually evolves into a trading range. This is what traders should expect over the next several months, even if the EURUSD goes a little high in September.
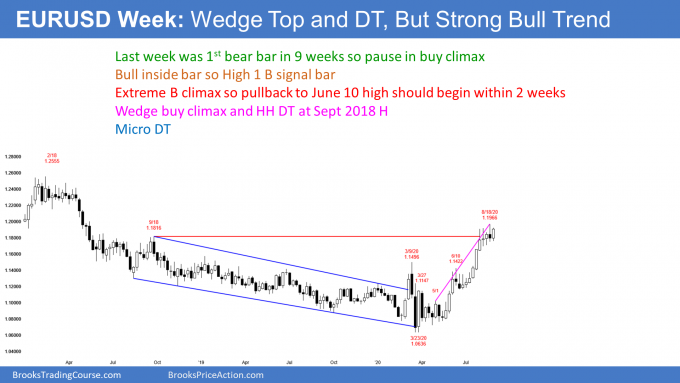
The EURUSD weekly chart formed an inside bar last week (see chart below). It was the fifth consecutive sideways bar and each of the five bars had prominent tails.
These weeks have been relatively neutral after an extreme three-month rally. But since last week was a bull inside bar closing on its high, it is a High 1 buy signal bar for next week. That increases the chance of at least slightly higher prices next week.
The bulls hope that the strong four-month rally will soon continue up to the February 2018 high at around 1.25. More likely, it will continue a little higher, maybe for a week or two, but then test down because of the wedge buy climax.
Streak of 8 bull bars is a buy climax
The bear bar of two weeks ago was the first bear bar after a streak of eight consecutive bull bars. While eight consecutive bull bars mean the bulls are strong, it is also unsustainable.
The last time there were eight or more consecutive bull bars was in 2004. That streak had 11 bull bars. A streak is a type of buy climax. The market often goes a little higher or sideways afterwards, but it then usually reverses for many bars. Consequently, traders should expect several weeks down beginning sometime in September.
Wedge buy climax
The four-month rally has had three clear legs up. It is therefore a wedge buy climax. Traders expect at least a couple legs down based both on the wedge and on the streak of bull bars. However, the third leg up was so strong that the bulls might get one more brief leg up in early September before the reversal down begins.
A wedge rally to a double top (the September 2018 high) is a common reversal pattern. The bears want a selloff down to the breakout points. These are the June 10 and March 9 highs.
Trading Room
Traders can see the end of the day bar-by-bar price action report by signing up for free at BrooksPriceAction.com. I talk about the detailed E-mini price action real-time throughout the day in the BrooksPriceAction.com trading room. We offer a two-day free trial.


