

Nine of the 11 S&P sectors finished higher for the week ending 06/04/21, states Bonnie Gortler of bonniegortler.com.
Six of them were stronger than the SPDR S&P 500 ETF Trust (SPY), +0.61%. Energy (XLE) and Real Estate (XLRE) were the leading sectors, +6.78% and +3.01%, respectively. Consumer Discretionary (XLY) and Healthcare (XLV) were the weakest sectors, down -1.05% and -1.22%.
S&P SPDR Sector ETFs Performance Summary
Week Ending 6/04/21
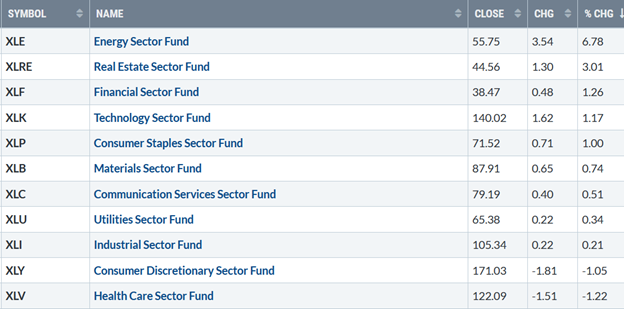
Source: Stockcharts.com
The major averages continued to move higher, all close to their all-time highs. International markets are gaining strength, outperforming the S&P 500. 10-Year Treasury yields fell last week, closing at 1.56% after Friday’s mixed jobs report implied a gradual recovery in the economy.
Yields remain in a trading range between 1.53 and 17.5 since March (orange rectangle) and trending down since May (Figure 1). Rates closing below 1.53% could help fuel growth stocks and likely slow the rise in the financial sector.
Figure 1: 10-Year Treasury Yields
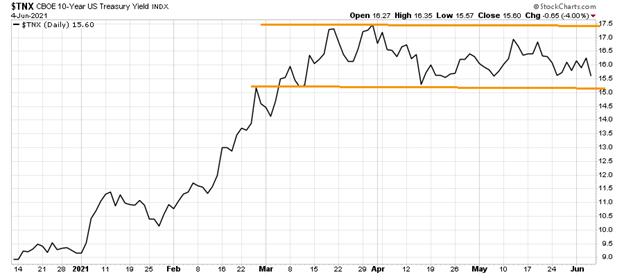
Source: Stockcharts.com
Emerging markets, financial, and technology stocks led the market higher last week. The Dow rose +0.66%, S&P 500 up +0.61%, Nasdaq was up + 0.48%, its third straight weekly gain, while the Russell 2000 index rose +0.77%.
Weekly market breadth was solid for the third week in a row. Both the Nasdaq and New York Stock Index (NYSE) had more stocks up than down. The New York Stock Exchange Index had 2317 advances and 1171 declines. Nasdaq had 2741 advances and 1785 declines. New lows on the NYSE again closed under 20, implying low risk and more gains ahead.
Figure 2: Daily New York Stock Exchange (NYSE) New Lows
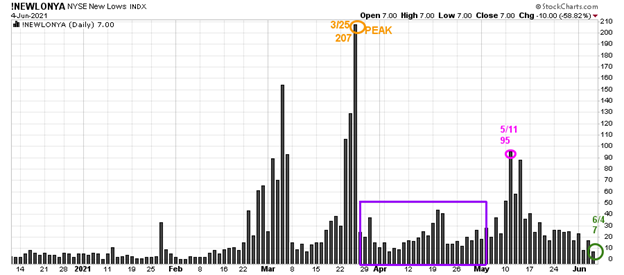
Source: Stockcharts.com
On 3/25, the NYSE new lows peaked at 207 (orange circle) and immediately contracted (purple rectangle).
On 5/11, new lows on NYSE jumped to 95, their highest level since late March flashing a warning sign, but new lows immediately dropped. On 5/28, they closed at 7 (green circle), showing healthy underlying internal strength.
Watching new lows on the New York Stock exchange is a simple technical tool that helps awareness about the immediate trend's direction. In my book, Journey to Wealth, when the new lows are below 25, the market is very strong (very low risk and prices tend to rise). When new lows are between 25 and 50, risk is low, and the odds of a further rally are likely.
If new lows begin to expand and have a succession of days over 95 (the 5/11 high) will imply more risk and a shift in trend. On the other hand, if they remain low, the odds favor the advance will continue.
It’s not how much money you make, but how much money you keep, how hard it works for you, and how many generations you keep it for.” —Robert Kiyosaki
ETFs to Monitor
Figure 3: Performance week of 5/28- 06/04
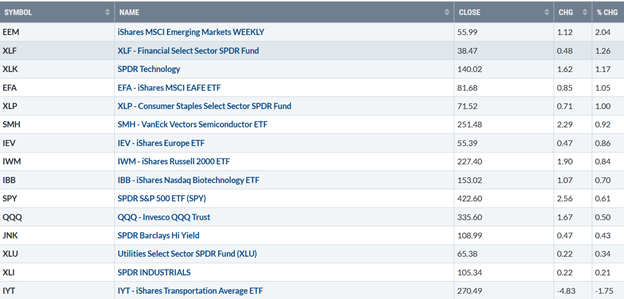
Source: Stockcharts.com
Positives
- The Russell 2000 (IWM) and Semiconductor (SMH) are showing increased relative strength vs. S&P 500 (SPY).
- International markets are supporting the rise in the USmarket and gaining relative strength. Emerging markets up 2.04% closed above resistance at 55.00. MACD is on a buy and gaining momentum after breaking the downtrend from February.
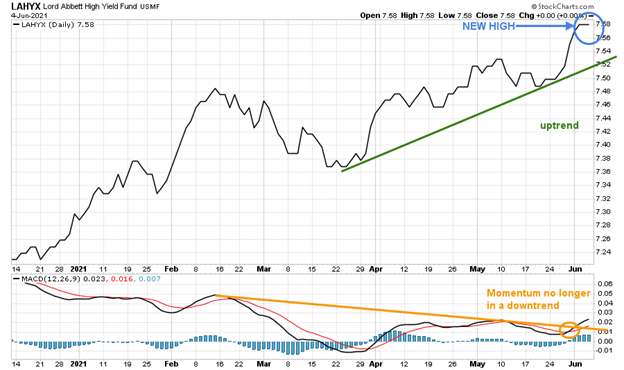
- Hi-Yield (JNK) and open-end high yield corporate bond funds rose last week and are at or near their highs, Figure 4.
- Semiconductors (SMH) was up 0.92%, its third week in a row higher, leading in relative strength vs. QQQ.
- IWM is on a MACD buy, closing above its 50-day MA and above its short-term downtrend from May.
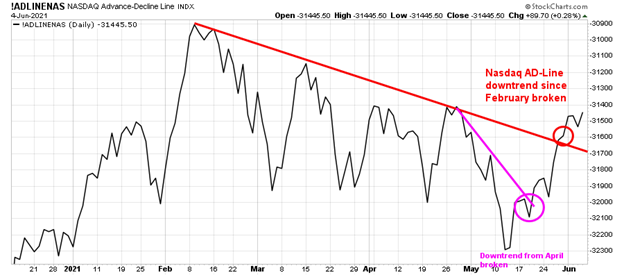
- The Nasdaq Advance-Decline has broken the downtrends from February and April, Figure 5.
- The NYSE A/D line made a new high (Figure 6). Historically rarely does the market make a final peak when the cumulative advance-decline line makes a new high.
Figure 4: LORD Abbett High Yield Fund
Source: Stockcharts.com
Figure 5: The Nasdaq Advance-Decline Line
Source: Stockcharts.com
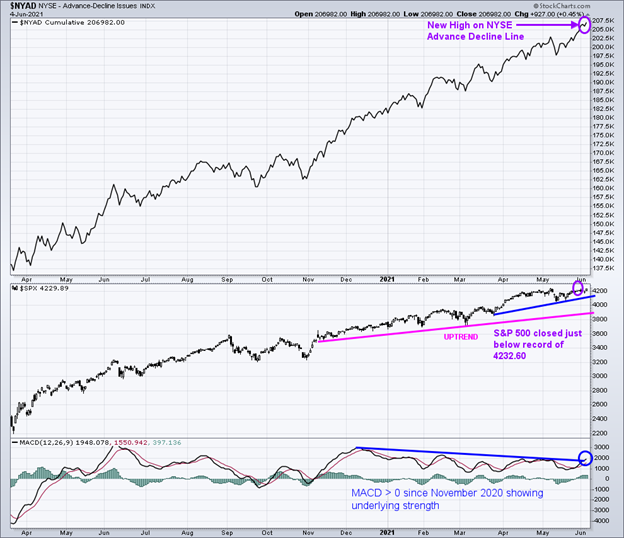
Figure 6: New York Stock Exchange Advance-Decline Line Top and S&P 500 Index Middle and MACD 12,26,9 Bottom
Source: Stockcharts.com
In the top portion of the chart (Figure: 6), The NYSE A/D line made a new high (purple arrow). Historically rarely does the market make a final peak when the cumulative advance-decline line makes a new high.
The advance/decline line (A/D) is one of my favorite technical indicators that measures market breadth. The A/D line shows how many stocks are participating in a stock market rally or decline. It represents a cumulative total of the number of stocks advancing versus the number of stocks declining. When the A/D Line rises, it means that more stocks are rising than declining (and vice versa).
The S&P 500 Index remains in an uptrend (blue line) from March (middle chart), closing at 4229.89, a few points from making a new record high (purple circle).
A close below the first support at 4100.00 would break the uptrend and warn of potential weakness. A close below 3723.34, the 3/4 low, would likely trip the sell stops and increase selling pressure beginning a more sustained decline.
The bottom chart is the S&P 500 and its 12,26,9 MACD, a measure of momentum. Notice how MACD remains >0 since November 2020, showing underlying strength.
MACD last week made a slight penetration of the downtrend since December 2020, a sign of strength and more gains to follow.
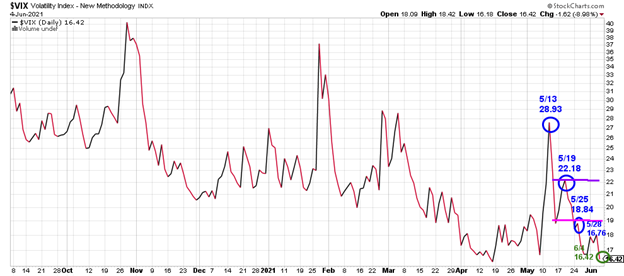
Figure 7: CBOE Volatility Index (VIX)
Source: Stockcharts.com
Volatility has quieted, as measured by The CBOE Volatility Index (VIX). After peaking on 5/13 at 28.93, VIX continues to decline, closing at 16.42. A close above 18.84 would imply an increase in day-to-day volatility.
Key ETFs to pay attention 6/4 – 6/9
Watch for strength in Emerging Markets (EEM), Russell 2000, Invesco Trust Nasdaq (QQQ), and Semiconductor for evidence of further gains this week.
Figure 8: iShares MSCI Emerging Markets (EEM)
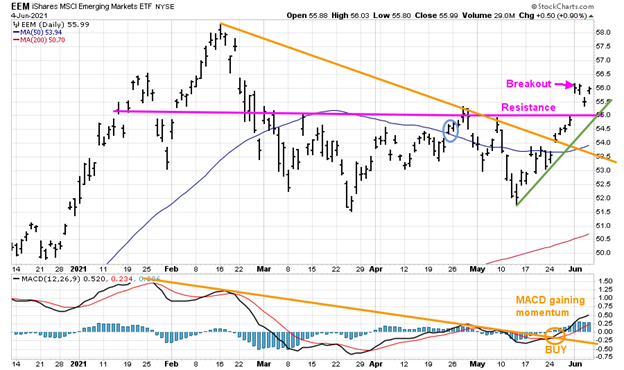
Source: Stockcharts.com
EEM has consolidated the past few months and has now broken through resistance, a breakout. 58.50 is the short-term upside objective. Support is at 55.00.
In the lower chart, MACD is gaining momentum and at its highest level since last February, a positive sign for the near term.
Figure 9: iShares Europe/S&P 500 (IEV/SPY) Relative Strength Ratio
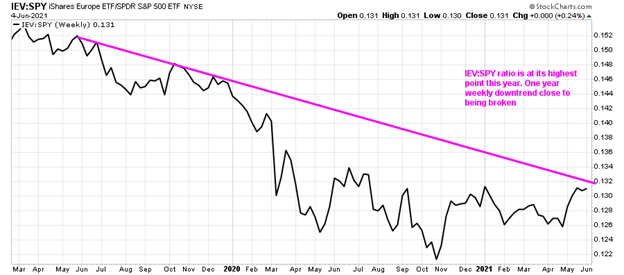
Source: Stockcharts.com
Europe (IEV) continues to gain relative strength compared to the S&P 500. The IEV/SPY ratio is at its highest point this year.
Watch for strength in Europe if it will break the one-year weekly downtrend. If the downtrend is broken, Europe will likely outperform the US in the coming weeks to months.
Figure 10: Daily iShares Russell 2000 (IWM) Price (Top) and 12-26-9 MACD (Bottom)
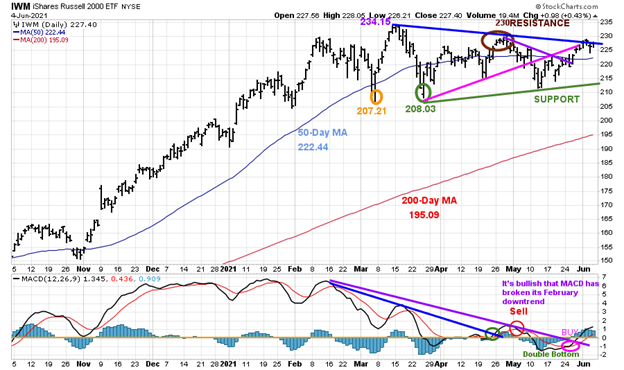
Source: Stockcharts.com
The top portion of the chart is the daily iShares Russell 2000 Index ETF, the benchmark for small-cap stocks, with a 50-day moving average (blue line) and 200-day moving average (red line) that traders watch and use to define trends.
IWM made a low on 3/5 at 207.21 (orange circle), then peaked at 234.15. On 3/25, IWM successfully tested its low at 208.03 (green circle) and then stalled at 230.00, key resistance (brown circle).
IWM is more attractive now, after breaking its short-term downtrend from April (purple line) and closing over the first resistance of 225.00, back to its uptrend line (pink). IWM closed above its rising 50-day moving average, positive signs that IWM will work its way higher.
Last week not much change in IWM, up +0.43%. IWM closed under resistance at 230.00 and in the area of the March downtrend (blue line). A close above 230.00 would be bullish and imply a test of the old highs and give new upside projections.
On the other hand, If IWM turns down if IWM closes below 222.00, it would not bode well for the broad market.
The bottom half of the chart is MACD (12, 26, 9), a measure of momentum. After MACD broke the short-term downtrend from February (blue line), there was no thrust to the upside, and MACD gave a sell signal, turning down from above 0.
A different message now. MACD is on a buy. MACD is rising after a double bottom formation and above its downtrend (purple line). I expect IWM to get through resistance at 230.00 and take out the old highs beginning another leg higher in the near term.
A close below the March low at 207.21 would negate my bullish outlook and imply a more serious decline.
Figure 11: Daily Invesco QQQ Trust Nasdaq (QQQ) Price (Top) and 12-26-9 MACD Bottom)
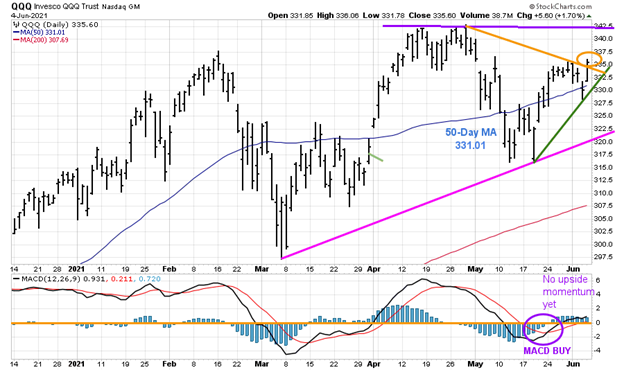
Source: Stockcharts.com
The top part of the chart shows the daily Invesco QQQ, an exchange-traded fund based on the Nasdaq 100 Index with its 50-day moving average and 200-day moving average.
QQQ closed strong on 6/4, up 1.7%, breaking its May downtrend (orange circle), helped by Apple (AAPL) and Microsoft (MSFT), two of its top holdings up sharply. Now that the May downtrend was broken, QQQ is likely to test the 4/29 high of 342.80.
The bottom chart is MACD (12, 26, 9), a measure of momentum. MACD turned up from an oversold condition, below 0, and is now on a buy. No upside momentum yet but could change quickly if QQQ rises.
Support is at 327.50, followed by 317.50. A close below 317.50 implies a more serious decline and negates the bullish pattern.
Figure 12: Daily Vaneck Vectors Semiconductor (SMH) Price (Top) and 12-26-9 MACD (Bottom)
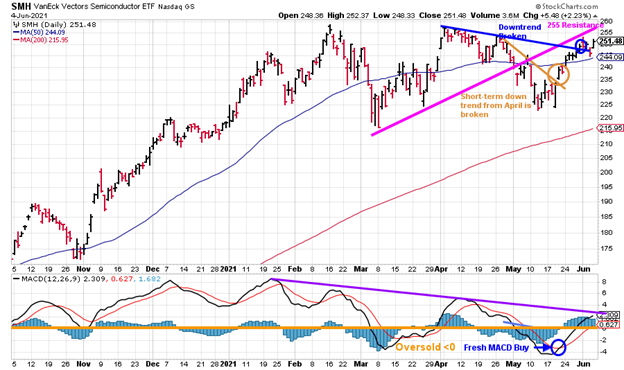
Source: Stockcharts.com
The top chart shows Semiconductors (SMH).
Semiconductors remain strong in recent weeks. Similar to QQQ, SMH broke its April downtrend (blue line), shifting the trend to up. SMH closed on Friday at 251.48 above its first resistance is at 250.00.
The lower chart is MACD, a measure of momentum. MACD remains on a buy and is gaining momentum. SMH remains stronger than QQQ in terms of relative strength. Watch for MACD to break the downtrend from January (purple line) to confirm continued strength in SMH, which would bode well for the broad market.
Resistance is at 255.00. A close above 255.00 would imply a new leg up. Support is at 248.00 followed by 244.00 and 240.00.
A close below 240.00 would be a warning sign the present rally will come to an end.
Intriguing Chart
Dow Jones US Industrial Transportation Average $DJUSIT
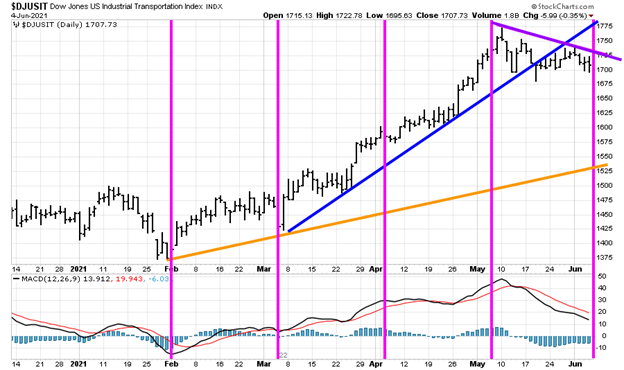
Source: Stockcharts.com
Watch the Dow Jones US Industrial Transportation Average $DJUSIT. After trending down since early May, a cycle bottom is possible, bullish in the near term.
Summing Up:
The major averages all closed near their all-time highs. International markets are outperforming the S&P 500, gaining strength. Emerging markets (EEM) has a short-term upside objective to 58.50. The Nasdaq closed the week with its best gain in two weeks. Momentum patterns and market breadth are favorable. The NYSE Advance-Decline Line made a new high while the Nasdaq Ad-Line has broken its downtrends from February and April. The tape remains positive. I am looking for another leg up. The key closing numbers to watch for potentially a significant decline to begin are below 207.21 for IWM and below 317.50 for QQQ.
Remember to manage your risk, and your wealth will grow.
I would love to hear from you. If you have any questions or comments or would like to talk about the market, email me at Bonnie@Bonniegortler.com
Learn more about Bonnie Gortler at BonnieGortler.com
Disclaimer: Although the information is made with a sincere effort for accuracy, it is not guaranteed that the information provided is a statement of fact. Nor can we guarantee the results of following any of the recommendations made herein. Readers are encouraged to meet with their own advisors to consider the suitability of investments for their own particular situations and for determination of their own risk levels. Past performance does not guarantee any future results.


