

Leadership once again is in the S&P 500 (SPX), although the NASDAQ Composite and the NASDAQ-100 (QQQ) are strong as well, asserts Larry McMillan of Option Strategist.
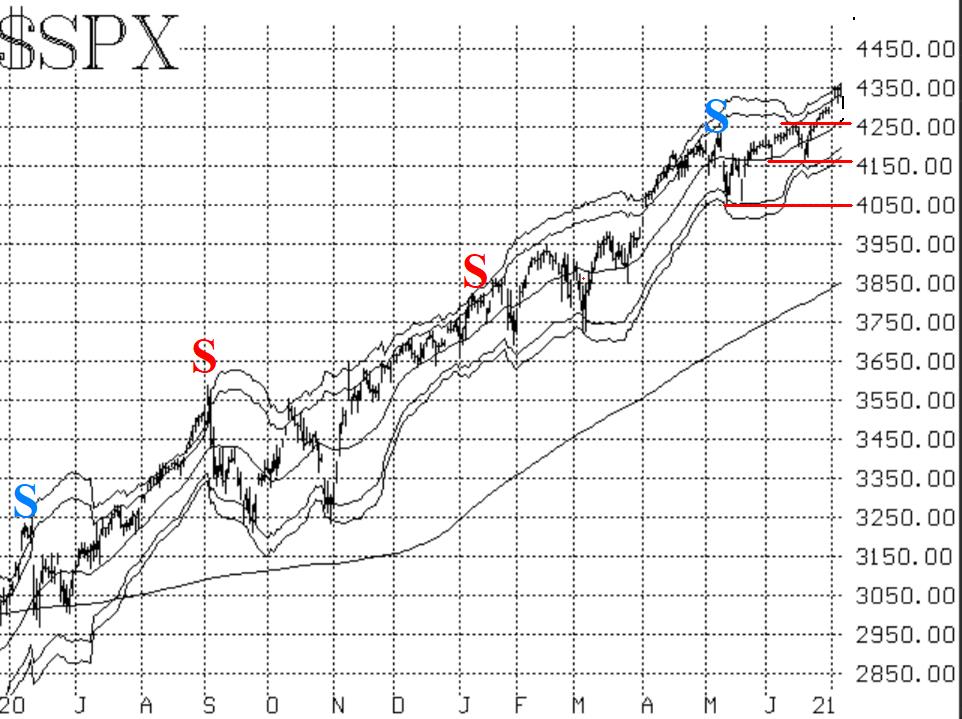
Since the SPX chart is our primary indicator, we retain a "core" bullish position as long as SPX holds above support: 4260 (the early June highs), 4165, and 4060 the latter two being the twice-tested lows of June and May, respectively.
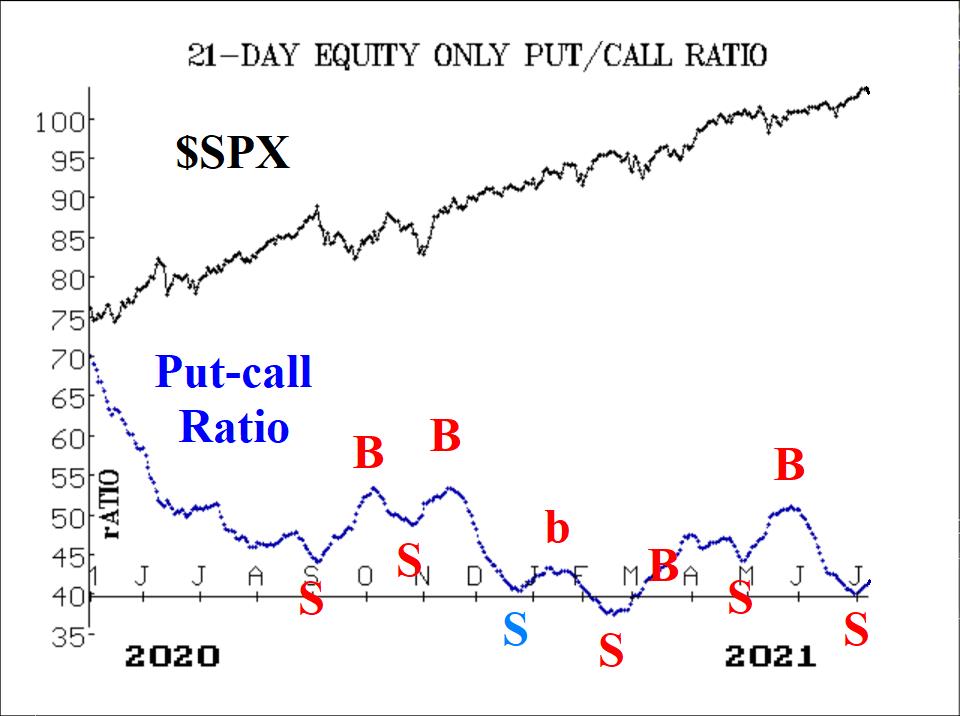
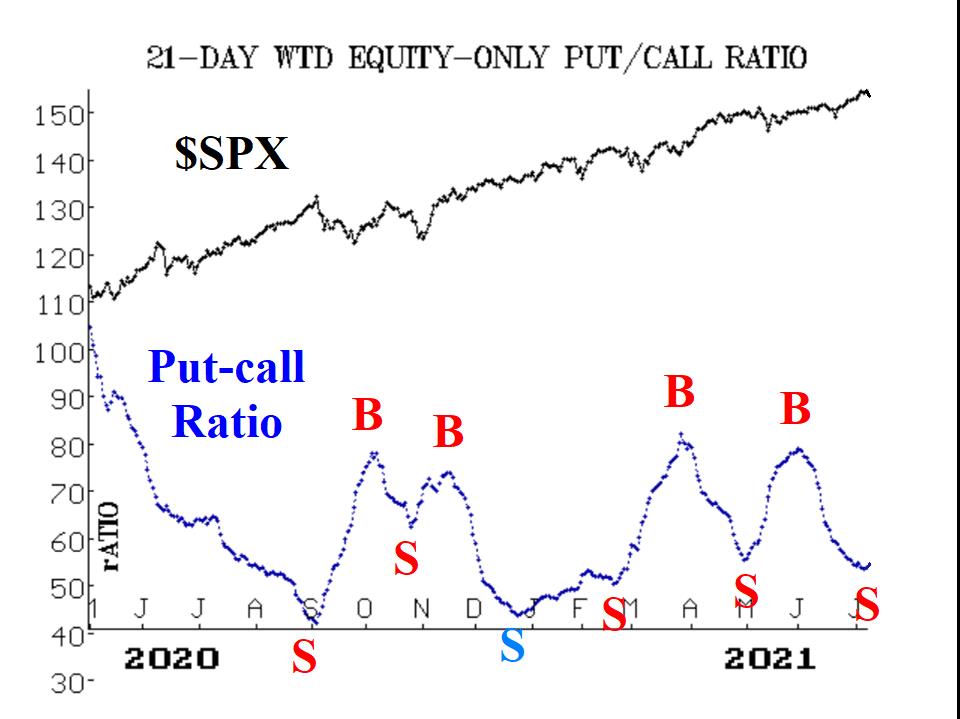
There are some negative warnings beginning to appear, however. One area which has turned negative, with new confirmed sell signals, is that of the equity-only put-call ratios. These new signals are confirmed by the computer analysis programs that we use to analyze these charts. Both have started upwards, with the standard ratio being more obvious to the naked eye. As long as they are rising, they will be on sell signals.
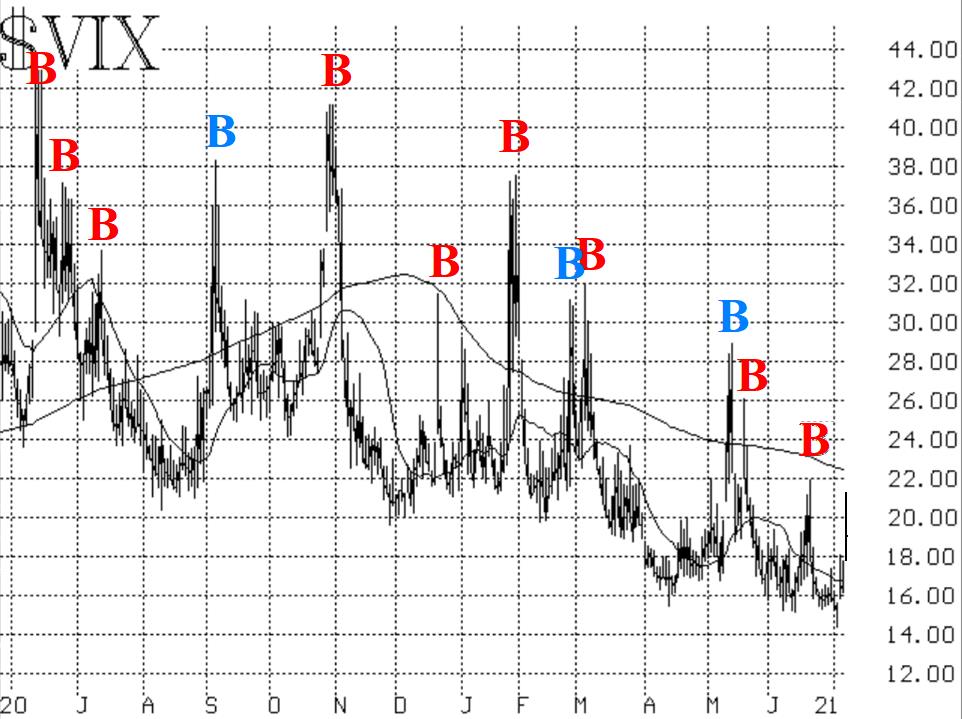
Another negative area is breadth. The breadth oscillators are both on sell signals. The cumulative breadth indicators are also well below their all-time highs of early June. Despite the negativity in put-call ratios and breadth, implied volatility generally remains friendly towards the bulls. A new SPX Volatility Index (VIX) buy signal will be setting up soon, possibly as early as today.
In summary, it is tempting to get preoccupied with the growing number of negative indicators. However, until the charts of SPX and VIX alter their trends, this is still a bull market.


