

Eight of the 11 S&P sectors finished higher for the week ending 07/09/21, states Bonnie Gortler of bonniegortler.com.
Four gained more than the SPDR S&P 500 ETF Trust (SPY), up +0.42%. Real Estate (XLRE) and Utilities (XLU) were the leading sectors, +2.66%, and +0.91%, while Financials (XLF) and Energy (XLE) lagged down -0.62% and -3.36 %.
S&P SPDR Sector ETFs Performance Summary
Week Ending 7/09/21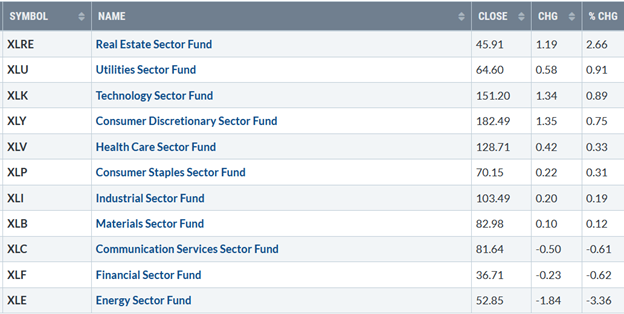
Source: Stockcharts.com
10-year Treasury yields fell, hitting their downside objective of 1.27%, (green arrow), its lowest level since mid-February before finally closing at 1.35%. A further decline in the near term will likely attract more buying into growth stocks and put more downside pressure on financials and small-cap stocks.
Yields could fall to 1.20% in the near term and potentially go to 1.07% (Figure 1 in purple), the lower channel objective. On the other hand, a close above 1.52% would imply higher yields in the future.
Figure 1: 10-Year Treasury Yields 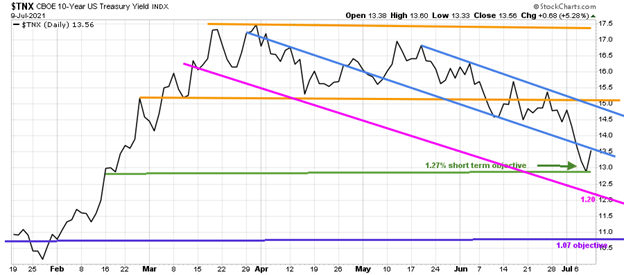
Source: Stockcharts.com
The S&P 500 broke its seven-day winning streak but finished higher. The Dow gained +0.24%, S&P 500 up +0.40%, and Nasdaq gained +0.43% in a volatile week. The Russell 2000 index lagged again, down -1.12%.
Weekly market breadth was negative for both the NYSE and Nasdaq. The New York Stock Exchange Index (NYSE) had 1488 advances and 1977 declines. Nasdaq had negative breadth despite finishing the week at record highs with 1682 advances and 2883 declines.
Figure 2: Daily New York Stock Exchange (NYSE) New Lows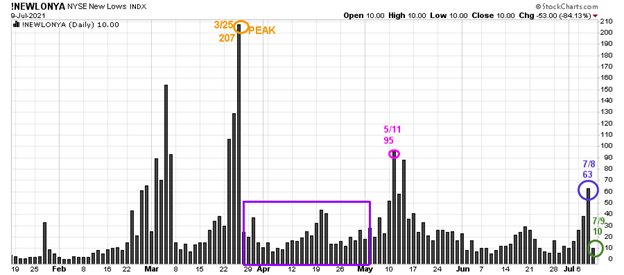
Source: Stockcharts.com
On 3/25, the NYSE new lows peaked at 207 (orange circle) and immediately contracted (purple rectangle). On 5/11, new lows on NYSE jumped to 95, their highest level since late March flashing a warning sign, but new lows immediately dropped.
New lows jumped to 63 intra-week (purple circle on 7/8) but closed at 10 (green circle) after Friday's explosive rally, remaining in the lowest-risk zone, where stock prices tend to rise.
Watching new lows on the New York Stock exchange is a simple technical tool that helps awareness about the immediate trend's direction. In my book, Journey to Wealth, when the new lows are below 25, the market is very strong (very low risk and prices tend to rise). When new lows are between 25 and 50, risk is low, and the odds of a further rally are likely.
If new lows begin to expand and have a succession of days over 95 (the 5/11 high), this will imply more risk and a shift in trend. On the other hand, if they remain low, the odds favor the resumption of the rally.
No price is too low for a bear or too high for a bull. – Unknown
ETFs to Monitor
Figure 3: Performance week of 7/2/21 - 07/9/21 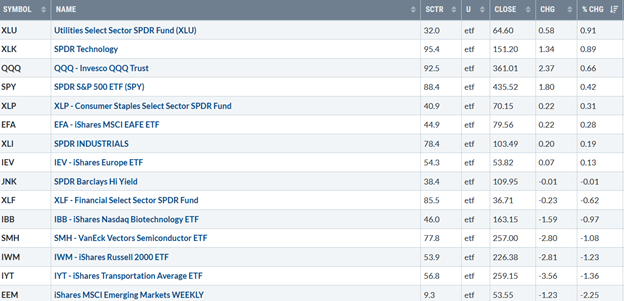
Source: Stockcharts.com
Positives
- The trend remains up. The S&P 500, Nasdaq 100, and Dow Industrials finished the week at record highs.
- Hi-Yield (JNK) and open-end high yield corporate bond funds remain in an uptrend closing near their highs (Figure 4). There was no selling pressure during the decline.
- The Transportation Average (IYT) rallied sharply on Friday, closing above its June downtrend after a potential fake breakdown. MACD remains on a buy (Figure:7) with rising money flow after turning down earlier in the week.
- Market sentiment based on CNN Fear and Greed Index (contrary indicator) fell to 36 from 44 to (Figure:5), now showing fear.
Negatives
- New highs on the Nasdaq and New York are contracting, not expanding. Both are below their 2021 new highs (Figure 6).
- Market breadth is weakening with fewer stocks participating in the rally as the major averages work their way higher.
- The bearish sentiment of the AAII Sentiment Survey (AAII) (contrary indicator) shows pessimism is below its historical average of 30.5% for the 22nd consecutive week closing at 24.5%.
- Volume patterns on the New York Index and Nasdaq have not confirmed the highs.
- IWM remains weak, down -1.3%, as other major averages made new highs. The weekly relative strength ratio (Figure:11) compared to the S&P 500 (IWM/SPY) continued to fall, closing below support (Figure 10).
- International markets are weak and no longer supporting the US market.
Figure 4: LORD Abbett High Yield Fund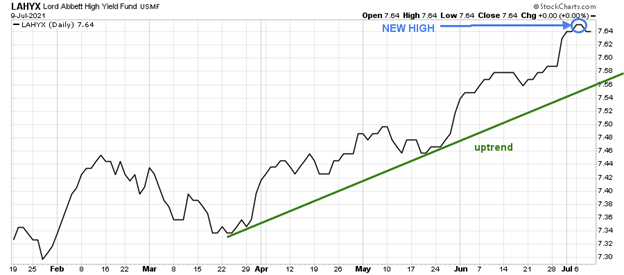
Source: Stockcharts.com
Figure 5: CNN Fear and Greed Index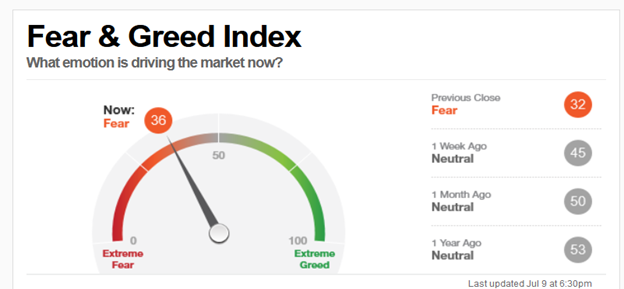
Source: CNN Business
Figure 6: Nasdaq New Highs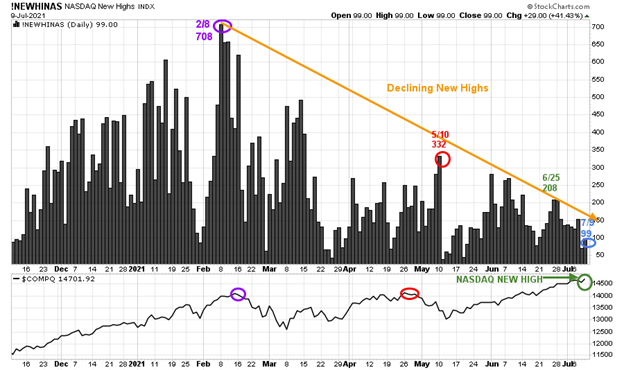
Source: Stockcharts.com
Despite the new high in the Nasdaq, stocks making new highs were only 99, continuing to contract and below the peak reading of 708 set on 2/8. Watch if new highs begins to increase or continue lower. If they can expand to over 332, this will be a clue of further gains in the near term and more stocks participating in the rally. On the other hand, if new highs remain low, the Nasdaq rally will likely end sooner rather than later.
Figure 7: Ishares Transportation Average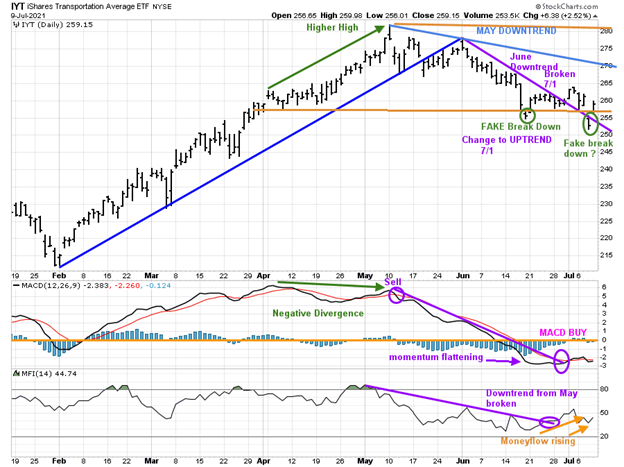
Source: Stockcharts.com
The top chart is the Transportation Average, which peaked in May. The June downtrend was broken (purple line), but the rally failed quickly after not penetrating the May downtrend. Last week IYT fell below support for one day, a second false breakdown, before reversing higher on Friday.
It would be positive if IYT could begin to outperform the S&P 500 and close above 265.00 and then over 275.00, breaking the May downtrend. A close below 252.77 for two days would be bearish and imply an acceleration of the downtrend to potentially 230.00.
Momentum indicators remain hopeful.
MACD (middle chart) is on a buy and above its May downtrend. The lower chart is Money Flow (MF). Its positive Money Flow broke the May downtrend (purple line) and is rising, despite the weakness in IYT.
Figure 8: CBOE Volatility Index (VIX)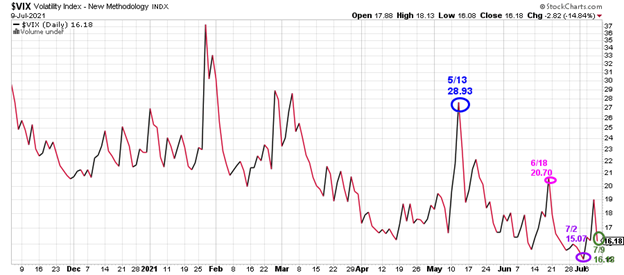
Source: Stockcharts.com
CBOE Volatility Index (VIX) showed complacency closing at 15.07 on 7/2, its lowest level since 2/20/20, and below its long-term average under 20.00
Day-to-day volatility increased last week during the decline as VIX made an intraday high of 21.29 on 7/8. Buyers stepped in on Friday, and VIX fell sharply, closing at 16.18.
A close above 20.70 (6/18 close) would imply an increase in day-to-day fluctuations and a warning a correction is likely to begin.
Figure 9: Daily iShares Russell 2000 (IWM) Price (Top) and 12-26-9 MACD (Bottom) 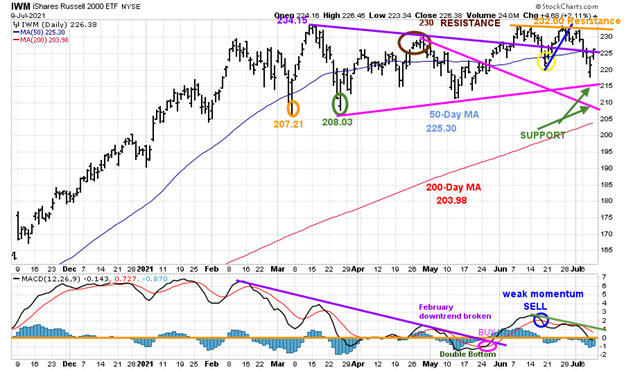
Source: Stockcharts.com
The top portion of the chart is the daily iShares Russell 2000 Index ETF (IWM), the benchmark for small-cap stocks, with a 50-day moving average (MA) (blue line) and 200-day moving average (MA), that traders watch and use to define trends.
IWM made a low on 3/5 at 207.21 (orange circle), then peaked at 234.15. On 3/25, IWM successfully tested its low at 208.03 (green circle) and then stalled at 230.00, key resistance (brown circle).
IWM closed at 226.38, down -1.2%, after breaking below the first support at 225.00. IWM was strong Friday off of its low at 217.85, closing slightly above its short-term downtrend from April (purple line), implying another rally attempt is likely. Resistance is at 230.00, followed by 234.00. Support is 225.00, followed by 215.00 and 210.00 (green arrows).
A close below the March low at 207.21 would imply an increased risk of a potential top made and a decline to 185.00.
The bottom half of the chart is MACD (12, 26, 9), a measure of momentum. MACD remains on a sell, continuing to lose momentum. More weakness in MACD would imply IWM is likely to test the support between 210.00 and 215.00.
Figure 10: Weekly iShares Russell 2000/S&P 500 (IWM/SPY) Relative Strength Ratio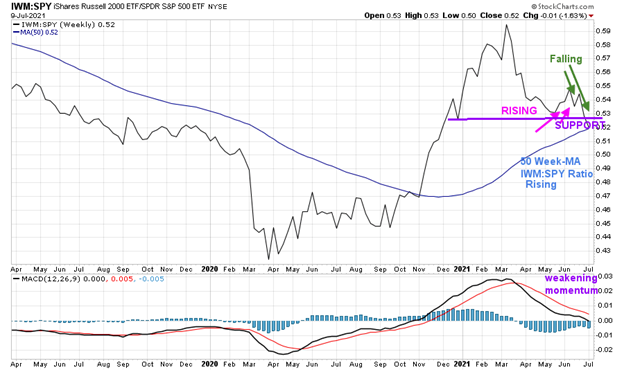
Source: Stockcharts.com
The weekly IWM /SPY ratio is flipping back and forth, now falling but remains above the 50-week moving average (MA), which continues to rise. However, it’s not a positive sign MACD is falling and making lows. I expect IWM to remain weaker than the S&P 500 until IWM is stronger than the S&P 500 (SPY).
Figure 11: Daily Invesco QQQ Trust Nasdaq (QQQ) Price (Top) and 12-26-9 MACD bottom)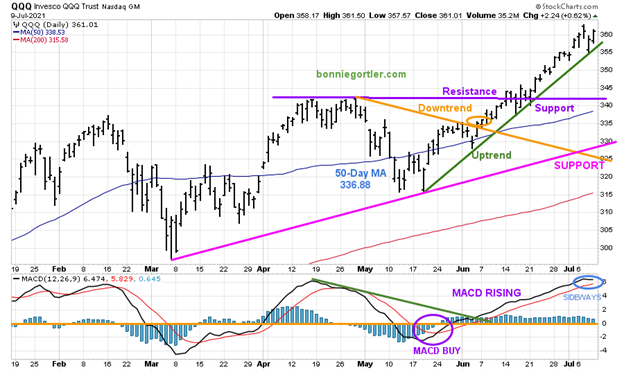
Source: Stockcharts.com
The top part of the chart shows the daily Invesco QQQ, an exchange-traded fund based on the Nasdaq 100 Index with its 50-day moving average and 200-day moving average. QQQ broke its May downtrend (orange circle) on 6/4 and is still in an uptrend. QQQ gained .4% for the week. The upside objective remains 370.00. A close below 350.00 would be a sign reaching 370.00 may not occur
Support is at 342.50, followed by 338.00, 335.00, and 327.50.
A close below support at 327.50 would break the uptrend from March and increase the odds the decline will accelerate and test the March lows.
The bottom chart is MACD (12, 26, 9), a measure of momentum. MACD remains on a buy but is now moving sideways. Be alert if MACD starts to turn down and then generates a sell, implying that the easy money is over and increased risk the advance is over.
Figure 12: Daily Vaneck Vectors Semiconductor (SMH) Price (Top) and 12-26-9 MACD (Bottom)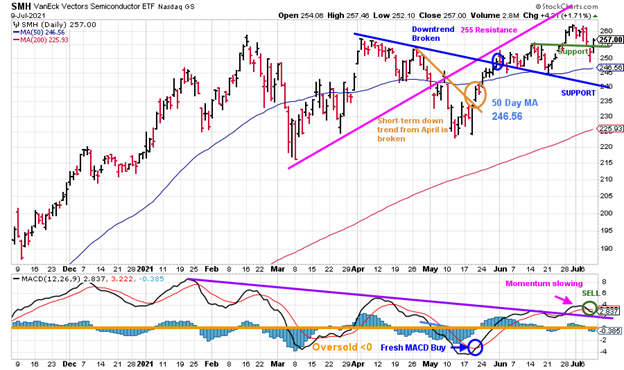
Source: Stockcharts.com
The top chart shows semiconductors. Semiconductors have risen since breaking their April downtrend (blue line) with an upside objective to 276.00.
SMH closed on 7/9 at 257.00, down -1.08% after falling below support at 255.00 intraday on 7/8.
Support is at 255.00 followed by 240.00. A close below would imply a test of the March lows.
The lower chart is MACD, a measure of momentum. MACD flipped to sell but holding above the downtrend from January (purple line). MACD made a higher high, confirming the high in SMH, implying another rally that appears to have started. I recommend caution on any close below Thursday's low of 248.89.
Summing Up:
Daily volatility is on the rise and market breadth continues to weaken. Momentum patterns continue to weaken. Fewer and fewer stocks are participating in the rally as the major averages make new highs. Global markets continue to lose strength compared to the S&P 500, no longer supporting the US market. Earnings season is starting with high expectations. If there is no follow-through to Friday's rally, a market correction could begin soon. If you are a short-term trader, respect your stops and be patient before adding to your investments, waiting for your ideal setup to form. The key closing numbers to watch for a major trend change are below 207.21 for IWMand below 327.50 for QQQ.
Remember to manage your risk, and your wealth will grow.
I would love to hear from you. If you have any questions or comments or would like to talk about the market, email me at Bonnie@Bonniegortler.com.
Learn more about Bonnie Gortler at BonnieGortler.com.
Disclaimer: Although the information is made with a sincere effort for accuracy, it is not guaranteed that the information provided is a statement of fact. Nor can we guarantee the results of following any of the recommendations made herein. Readers are encouraged to meet with their own advisors to consider the suitability of investments for their own particular situations and for determination of their own risk levels. Past performance does not guarantee any future results.


