

The new highs in the market developed without a confirmation from the market’s breadth last week, says Joe Duarte of In the Money Options.
That’s a very tricky situation, which warrants a detailed trading approach. So now, it’s all about whether Covid slows the global economy once again and whether the Fed decides to increase QE. The algos seem to be betting on the latter.
Those who blinked last week missed yet another buy-the-dip opportunity. And although that may be adding salt to wounded trader pride, by now we should expect the unexpected from the algos. In fact, if you’re looking to find a plausible explanation for the violent upside reversal following the equally violent short-term drop in stocks last week, look no further than the rising Covid numbers and the already evident drag on the most recent batch of economic numbers (PMI, housing data).
Believe it or not, algos do learn. And what they seem to have learned over the last 15 months is that the Fed, no matter what it says it will do, will not taper QE in the face of rising Covid infections. As a result, it looks as if the bulls might have gotten a reprieve for now.
That said, there are some interesting developments to consider, as I describe in the following sections. Indeed, a big fly in the ointment is that glaring lack of confirmation of the new index price highs from the New York Stock Exchange Advance Decline line (NYAD). In other words, this is one of those markets where owning stocks is hard to avoid, because of the new index highs. But it’s also one in which being very selective and risk averse will likely pay off, maybe sooner rather than later.
Bulls Try to Make Stand
New highs in the major indexes and lagging market breadth is definitely a setup for tricky trading.
Last week, in this space I noted: “I hate to be bearish. And maybe it’s just a passing thing. It’s hard to argue with the price charts at the moment. And their message is that the stock market is at a vulnerable spot. Moreover, that means that everything (MELA) is now vulnerable.”
Of course, since this whole thing started in mid-July, we’ve had a mini crash and a huge bounce back, all within a couple of days of one another (see below for full details). And yes, this raises more questions than providing answers.
So, let’s see where things stand.
The Three Bogeymen Part 2 – Covid is the Dark Horse
Last week I noted that there were three new bogeymen in town:
- The specter of higher taxes
- The Covid-19 situation
- The market’s breadth (see below for details)
Taking the third one first, the charts have improved. But as I note below, the market’s breadth remains soft, which means that stocks are still vulnerable. Certainly, that could change. But it’s still worth watching, especially if the New York Stock Exchange Advance Decline line continues in its current posture. Regarding higher taxes, things remain uncertain, especially given the status of the third bogeyman: Covid-19.
The fact is that if reports of lockdowns in Australia, New Zealand, and Asia (Toyota closing plant temporarily in Thailand) are accurate, especially in the first two where this is their winter season, things could well get interesting for the Northern Hemisphere when colder weather arrives.
Moreover, there is conflicting data regarding the reason for high levels of new Covid cases in countries with large, vaccinated populations. Indeed, the data is fluctuating and can be confusing, especially when one looks at the death data, which has yet to climb in the face of the rising number of new cases. Of course, there is a lag time between the number of new cases and possible deaths. Meanwhile CDC data in the US shows that hospitalizations are up. Finally, there is the developing issue with a rising number of infections in those who have been vaccinated, as well as emerging data, which questions whether the vaccines are as effective as advertised.
So, what’s the bottom line? Covid is still a significant unknown. And confusion can lead to market volatility, which means that if the Fed decides to raise interest rates during a period of rising Covid uncertainty, the market action we saw in mid-July could look tame.
SPY Options Turn Moderately Bullish
As the options market goes these days so do stocks follow. Thus, it’s a positive for the bulls that the call buyers are making a comeback in the S&P 500 SPDR (SPY) options. For those unfamiliar with this dynamic here it is in a nutshell.
When traders buy call options, dealers (algos) sell call options. As a result, in order to hedge their short option (the call they sold), they buy stocks and stock index futures. The net effect is that stocks tend to move higher. The reverse is true as we saw during the most recent, albeit brief, decline in stocks where traders were buying puts and dealers were selling puts. In that instance, dealers were forced to sell stocks and sell stock index futures to hedge.
And thus, we had a major selloff.
Checking in on Checkpoint Software’s Bullish Chart Pattern
Checkpoint Software (CHKP) looks ready to break out from what seems to be a stealth algo buying spree.
The IT sector remains a market hotspot due to the nearly daily cyberattacks on companies of all sizes. And it’s clear that this dynamic isn’t going to change any time soon, which is why owning cyber security companies makes sense in any portfolio. However, what makes CHKP more interesting than others at the moment is the bullish chart pattern.
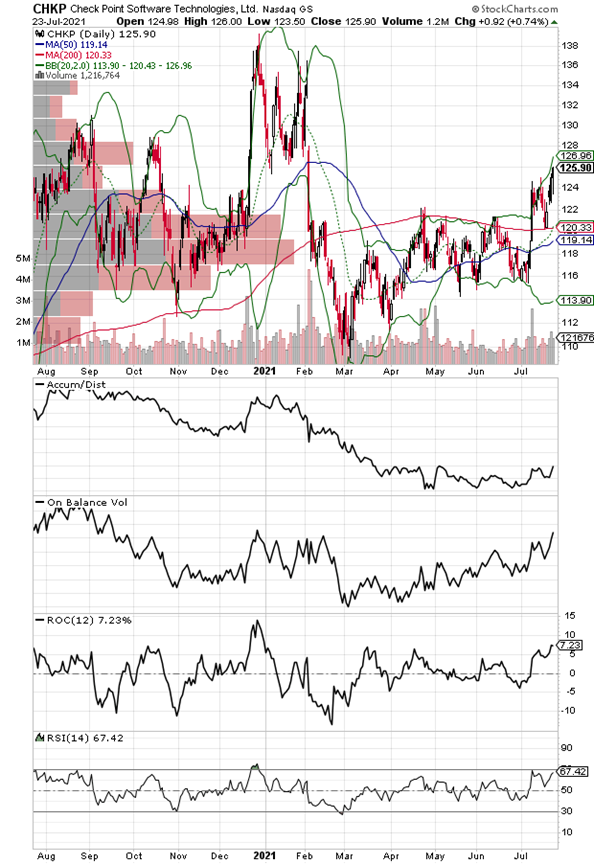
First, let’s look at the longer-term formation, which is clearly a basing pattern within a broad trading range. But more importantly, let’s focus on what’s happened since March 2020 with Accumulation Distribution (ADI), On-Balance Volume (OBV) and Volume by Price (VBP).
Specifically, consider that the ADI line has been falling until recently while the OBV line has been moving steadily higher. Also note that the price has been very volatile but roughly constrained between 110 and 120, until recently.
Now focus on the two large VBP bars near 120 and note that CHKP recently broke above those bars and is starting to gain strength.
Even better is the fact that the stock has now broken well above its 50- and 200-day moving averages which puts it the Complexity Zone, where bullish things happen to stocks in comparison to the Chaos Zone where prices turn to fall, often for long periods of time as when the stock broke below key support in February 2020.
Putting it all together, here is what emerges:
- ADI was falling because short sellers had the upper hand.
- However, OBV was rising because algos were buying all the dips created by short sales.
- The price move above the big VBP bars coincides roughly with ADI bottoming out. This means short sellers have given up.
- Meanwhile OBV keeps rising, which means that the algos and longer-term money continues to add to positions.
So what’s the bottom line? It looks as if the buyers are starting to overtake the sellers and this stock is setting up to move higher.
I own shares in CHKP at the moment.
Market Breadth Improves but Does Not Confirm New Index Highs
New highs in the major indexes without confirmation from the New York Stock Exchange Advance Decline line (NYAD) can lead to serious market declines. This, of course is what’s known as a negative divergence. And unless something changes in the next few days in this market, we could well be in that type of situation.
For now, the market gets the benefit of the doubt. But it is a somewhat soft benefit, as the longer the indexes make new highs without confirmation, the more likely will be the odds of a decline.
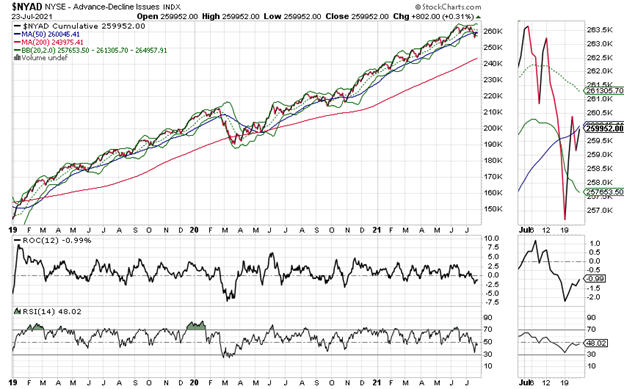
Moreover, if NYAD fails, at the very least, to move above its 50-day moving average with RSI climbing back above 50, things could get very interesting.
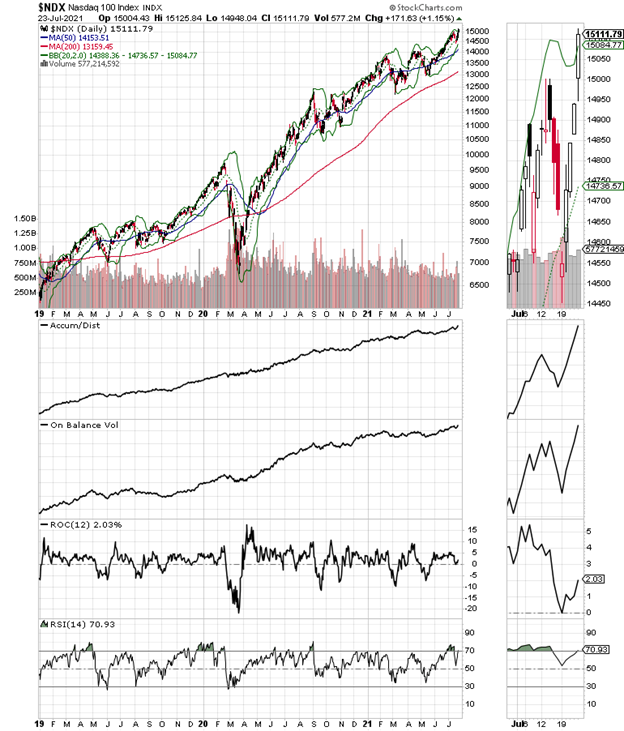
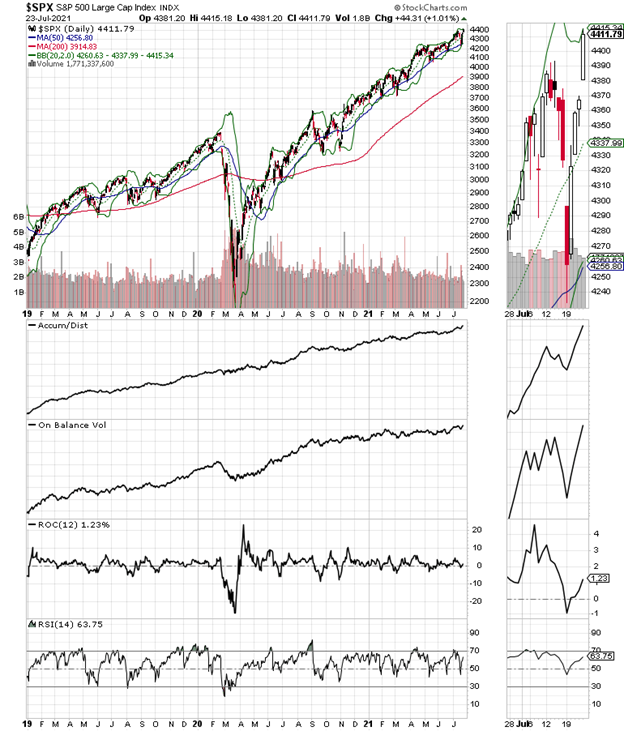
On the other hand, both the Nasdaq 100 (NDX) and the S&P 500 (SPX) indexes made new highs to end the week with fairly decent confirmation from ADI and OBV.
In other words, this market remains an interesting place to trade. And with so many unknowns regarding Covid, the only thing we can say is that things will develop on a daily basis.
To learn more about Joe Duarte, please visit JoeDuarteintheMoneyOptions.com.


