

The Federal Reserve announced that it will continue on its present course, leaving the Fed Funds rate at 0-0.25% and continuing $120 billion per month in quantitative easing, explains Marvin Appel of Signalert Asset Management.
Although Fed Chairman Powell said that the FOMC will in principle be open to scaling back on its quantitative easing, he expressed the view that labor market slack remains far too great for any change to be imminent. Raising interest rates is “not on the Fed’s radar” at this time.
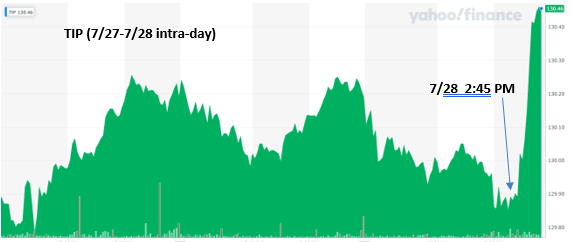
The immediate response following the announcement suggests that market participants view the Fed’s stance as inflationary. The S&P 500 Index and the Dow Jones Industrial Average had temporary bumps after the FOMC new release but ended the day roughly where they started (flat for the S&P 500, down 0.4% for the Dow Industrials). The iShares Russell 2000 Index ETF (IWM) jumped almost 1% before paring its post-news gains to 0.4%. The real fireworks occurred in the Treasury Inflation-Protected Securities ETF (TIP), which jumped 0.5% (see chart). The real yield on 10-year TIPS hit a record low of 1.18%.
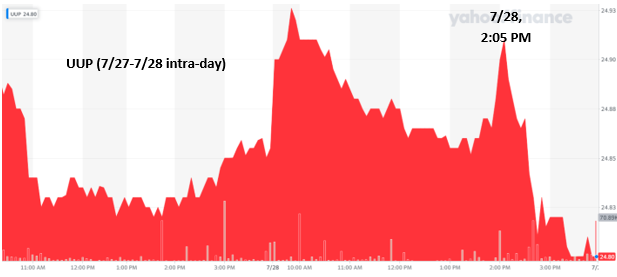
The other big move was a drop in the US dollar after the Fed announcement. The chart below shows that UUP dropped ½% in less than 90 minutes from the 2 PM press release.
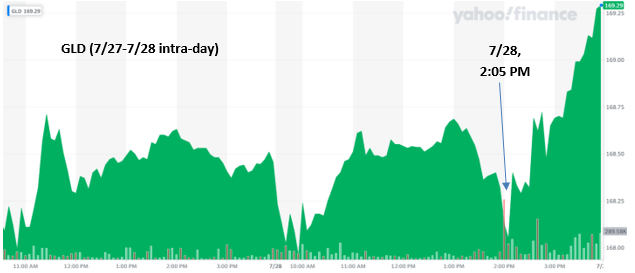
Gold moved opposite the dollar, with the SPDR Gold Trust ETF (GLD) rallying ¾% after the press release. (See chart below.)
Consistent with the theme that the markets view the Fed as pro-inflationary, high-yield bond ETFs (HYG, JNK) gained after the press release. However, investment-grade bond ETFs such as IEF (seven-10-year Treasury) and LQD (investment-grade corporates) also rose, while two-year Treasury note yields and the floating rate bond ETF (BKLN) stayed flat.
Putting it all together, these observations suggest:
- The market views the Federal Reserve as remaining unconcerned about the recent spike in inflation (as evidenced by the gain in TIP and GLD, and the drop in UUP).
- The Fed will continue quantitative easing, perhaps even a bit longer than anticipated (as evidenced by the gain in LQD and IEF).
- Overall conditions will remain conducive to economic growth (as evidenced by the gains in HYG, JNK, and IWM).
Implications—bond investors
The cat is out of the bag with Treasury Inflation-Protected Securities; inflation is already priced in, so even if actual inflation exceeds expectations by 2%/year over the next ten years, total returns from 10-year TIPS would likely be just above 3%/year if nominal rates stayed where they are.
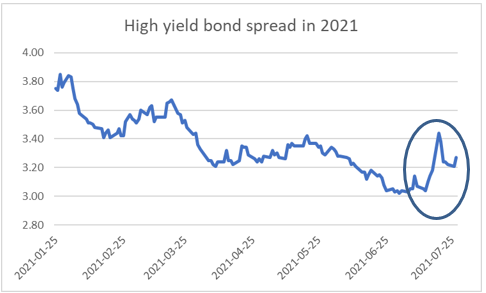
High-yield bonds are not cheap by any means, but the potential returns remain above 3%/year, especially if there is a correction in the sector and you use a timing model as we do. (Future results are not guaranteed.) The chart shows that in the past two weeks the spreads on high-yield bonds have widened a bit (circled). Our high-yield bond timing models remain on buy signals, so I view the bump in yields (drop in prices) as temporary.
On the other hand, prospects for floating-rate bond funds look a little less bright now that the Fed has decreased the likelihood of raising the Fed Funds rate (which determines the level of interest income from floating-rate funds). Our floating-rate models also remain on buy signals so I certainly would not sell, but if you are looking to add money to bonds, corporate and municipal high-yield funds seem the way to go.
State of the Market: Stocks were relatively quiet after the FOMC meeting but bonds signal persistent inflation.
In the ETF space, we like the short-term high-yield bond ETF (SJNK) if you can buy it at a discount to fair value and if you cannot trade an open-end bond fund.
Implications—stock investors should continue to favor large-caps
Once again, large-cap value and growth moved in opposite directions today (with growth rising). Thus continues the unusual situation where the blended index (S&P 500 or Russell 1000) is less volatile than its value component. That means that the risk-adjusted rewards accrue to holding the full index rather than overweighting either growth or value.
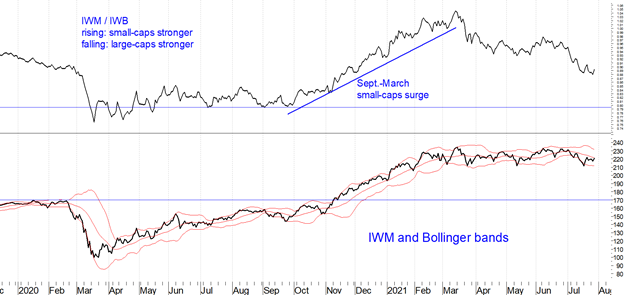
Small-caps did well today, but it is too early to bet that the Fed’s policies will spur a small-cap resurgence. The fast money in small-caps was made between September and March. (See chart below.) Since February 5 the iShares Russell 2000 Index ETF (IWM, small-cap benchmark) has been flat while the S&P 500 Index is up more than 12%.
Small-caps would have to underperform large-caps (IWB) by another 11% in order to reverse their Sept.-March run of outperformance. That would be a bottom-fishing area. Alternatively, if there is a 20% correction in IWM, that would bring it back to where it was pre-pandemic, which could be a support area for bottom fishing. Until either of these retracements occur (and they may not), stick with large-cap blend.
Currently favor SPY. What to watch in QQQ and XLP.
The three main large-cap ETFs that I follow are QQQ, SPY, and XLP. QQQ represents large-cap technology (Nasdaq 100 Index). Historically, the Nasdaq 100 Index was more vulnerable than the S&P 500 during market declines, but more recently its components’ ability to maintain earnings during recessions has actually made them more attractive when the economy is at risk of slowing. In other words, one-time highflyers are now acting somewhat like a defensive sector. However, the volatility of QQQ remains greater than that of the S&P 500.
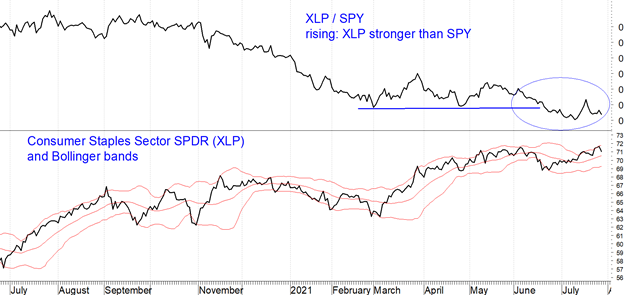
The classic defensive sector is consumer staples (XLP), which historically has had the advantage of below-average volatility and below-average losses during major bear markets. This was the case in February-March 2020, when SPY had a 34% drawdown and XLP lost less than 25%. Unlike QQQ, however, XLP has a history of earning less than the S&P 500 during bull markets. On a risk-adjusted basis, XLP has outperformed the S&P 500 since its inception in late 1998.
The S&P 500 SPDR should be the mainstay of investors’ equity exposure, in my opinion. Other areas of the stock market are more useful either as tactical tools to take advantage of potentially temporary opportunities, or as niche exposures to achieve special objectives. (Examples of the latter might include high-dividend stocks to generate a potentially growing stream of tax-favored income.)
The chart below of QQQ / SPY shows that QQQ has kept pace with (actually slightly lagged) SPY since 9/2/20. QQQ lagged significantly (QQQ / SPY falling) in February-March this year. However, since May QQQ has regained lost ground. A retest of the QQQ / SPY low would be a time to switch some of your equity exposure from SPY into QQQ.
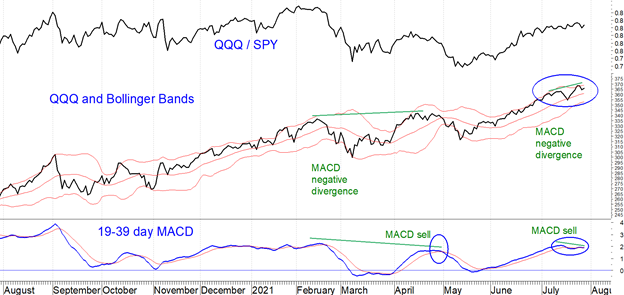
As a side comment, QQQ generated a MACD sell signal on July 28. MACD formed a negative divergence with price (i.e. price made a new high in late July, but MACD peaked at a lower value in late July than it had earlier this month). In addition, QQQ is near-term overbought by virtue of touching the upper Bollinger band.
Bottom line: Don’t chase the past ten weeks’ rally in QQQ. Wait for the next bout of economic optimism, which, if the February-March pattern repeats, could hold QQQ back and create an opportunity to buy at better prices relative to SPY.
Lastly, how should you handle consumer staples (XLP)? I like holding XLP as a core long-term holding because of its superior risk-adjusted performance historically. But on a tactical basis, XLP is not looking attractive. The ratio XLP / SPY is at its lowest since July 2007. I had expected that this would be an area where XLP should begin to outperform or at least match SPY. However, as circled in the chart below, the XLP / SPY ratio broke down in the past month suggesting potentially more time for XLP to lag. If you want to maintain equity exposure when our equity model goes to a sell signal, that would be a time to shift some assets from SPY to XLP. Until then, we will continue to monitor the relative performance of XLP and SPY, and if the XLP / SPY ratio can hold at current levels for another three months, that would be more indicative of a potential relative strength nadir in XLP that would be a buying opportunity compared to SPY.
To learn more about Marvin Appel, please visit Signalert Asset Management.


