

When screening for eligible securities for covered-call writing and selling cash-secured puts, we must establish how much risk we are willing to incur, explains Alan Ellman of The Blue Collar Investor.
There is no right or wrong here as the appropriate amount will vary from investor to investor. To determine security risk, we can look up implied volatility (IV) stats but that will simply give us a number, not how that stat integrates into our strategy goals and personal risk tolerance. Therefore, before entering our option-selling trades, we must establish our initial time-value return goal range, which will incorporate both the returns we are seeking while also factoring in the risk we are willing to take.
Option Time-Value Premiums and Implied Volatility
The amount of time-value our premiums will generate is directly related to the IV of the underlying security. The greater the IV, the greater the premium but also the more risk we are incurring. My sweet spot for my initial time-value return goal range is 2%-4% for one-month near-the-money strikes. It is 1%-2% for my mother’s more-conservative portfolio. I’ll go as high as 6% in strong bull markets but never higher. That is right for me but not necessarily for everyone. Let’s next compare the IV stats taken from one of our ETF Reports (3/10/2021) and show how these figures align with our premium time-value returns.
Premium ETF Report from 3/10/2021 Showing Conservative, Bullish, and Extremely Bullish IV Positions
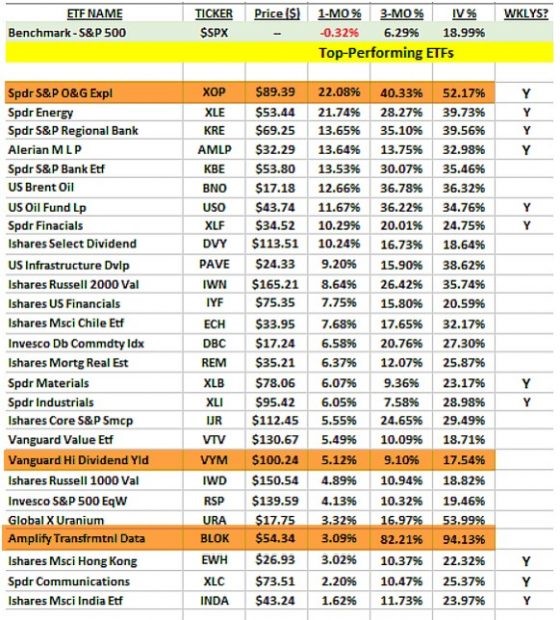
BCI ETF Report from 3/10/2021
I selected three diverse IVs from this report from conservative (VYM - 17.54%) to bullish (XOP - 52.17%) to extremely bullish (BLOK - 94.13%). I next went to the option chains for these securities and selected strikes two levels above and below each ETF current market value. These figures were then fed into the multiple tab of the BCI Calculators. These stats represented seven-week returns and I will convert to both annualized and monthly returns in this article.
Covered-Call Writing Calculations for BLOK, VYM, and XOP
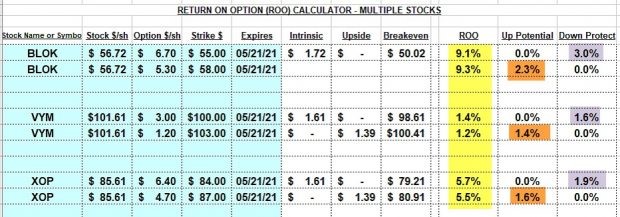
Covered Call Writing Calculations
- The yellow cells represent the 7-week initial time-value returns
- The brown cells represent the upside potential for the out-of-the-money strikes
- The purple cells represent the downside protection of the initial time-value returns for the in-the-money strikes
Annualized and Monthly Returns
- BLOK: 68.3%/5.7%
- VYM: 9.7% /0.80%
- XOP: 41.6%/3.5%
For me, XOP would be the best choice based on return goal/risk analysis. In strong bull markets, I would consider BLOK. VYM would be an appropriate choice for my mother’s portfolio.
Discussion
Implied volatility is critical to our option-selling success. It will define our premium returns, as well as measure our position risk. Before entering any trades, we must establish an initial time-value return goal range for a specified time-frame to assist in strike price selection. Because IV is directly related to time-value premium, it is not necessary to look up IV stats as option-chain analysis will suffice.
Learn more about Alan Ellman on the Blue Collar Investor Website.


