

In recent weeks, the Fed finally acknowledged that current inflationary pressure is not transitory, and they are on a path to raise interest rates quicker than previously anticipated, states Joon Choi of Signalert Asset Management.
Their December meeting minutes (published on January fifth) suggested that voting members may be willing to raise rates even faster and further than they had previously led us to believe to combat inflation. As a result, technology/growth stocks have been weaker than value stocks. Growth stocks have lower cashflow than their value counterparts but are expected to gradually increase over time. These future cash flows are more sensitive during a rising interest rate environment. Conversely, declining interest rates serve as a tailwind for growth stocks, as was the case when the S&P 500 Growth ETF (IVW) outperformed S&P 500 Value ETF (IVE) by 6% annually (12.7% vs. 6.7% respectively) as interest rates drifted lower from 2007 to 2021. In this article, I will recap my recommendation to increase your value stock and reduce your growth stock exposures and provide an update for a recommended market-neutral position.
Previous Recommendation Recap
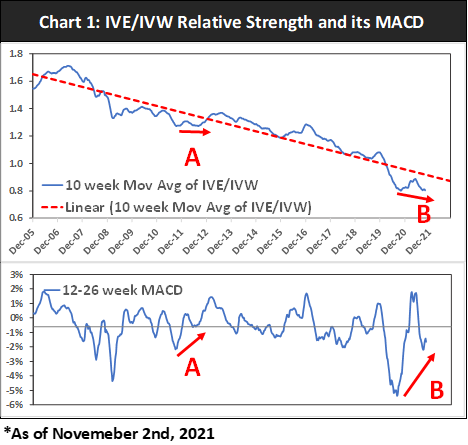
In my article early last November, I recommended increasing large cap value exposure while decreasing large cap growth weight (such as QQQ). In addition, I suggested implementing a market neutral position by buying IVE and selling short IVW based on their relative strength analysis. When I plotted the 10-week moving average of IVE/IVW relative strength and its 12-26 week MACD, I noticed a significant positive divergence between the two (Point B on Chart 1). It was reminiscent of Point A in 2012, when a similar bullish pattern formed in addition to IVE/IVW being below its trendline. The major difference between the two instances is that in the more recent occurrence IVE was significantly weaker versus IVW, as the MACD of relative strength was below -5% (2020) compared to -2% (2011). Thereby, creating a sharper positive divergence formation. I set the profit target of IVE/IVW market neutral position at 15% to 20%.
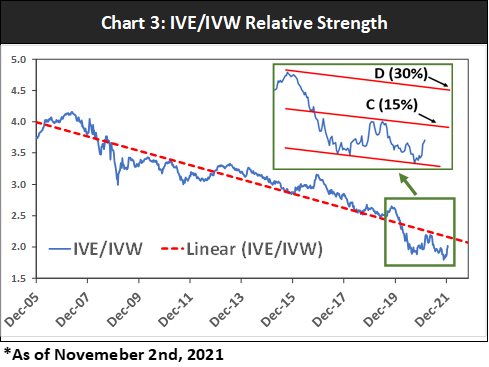
I believe there is much more upside potential as IVE/IVW relative strength (RS) has not even reached the trendline yet (dotted line in Chart 3). Therefore, I anticipate the position to reach at least a 15% profit if the RS stops at the trendline, which also happens to be the middle channel line (displayed in the enlarged view in Chart 3). However, I can imagine the target profit may reach near 30% before any substantial pull back as the expected rise in interest rates will continue to serve as a headwind for the growth stocks. I will provide updates on this position as needed.
To learn more about Joon Choi, please visit Signalert Asset Management .


