

The moving average is an indicator that calculates the average price over a given period, explains Inna Rosputnia, author, Basic Instinct of Trader.
So for an 18-day moving average, it calculates the average price over the last 18 candles. However, MAs do not forecast price direction but rather define the current trend smoothing the price data. In other words, it helps cut down the amount of noise on a chart.
Despite this, moving averages can be a handy tool helping traders to enter the market. For example, commodity traders can follow a simple trading strategy to take advantage of new trading opportunities using the 18-day moving average (MA).
Keynotes
- To find a trade with a good risk/reward ratio, look for qualified breakouts with an accumulation/distribution pattern (tight consolidation zone).
- Moving average doesn't move the market. It should be used only as an entry technique.
- An 18-day moving average strategy tends to work best in markets with a strong fundamental setup.
- It should be applied on a daily timeframe.
- 18-day MA has the highest accuracy in commodity markets.
Buying With 18 MA
We take the signals only on the daily chart with this strategy. Moreover, there has to be an accumulation zone before the qualified breakout. Accumulation means buyers are willing to buy the commodity (even in front of resistance). We can confirm it using indicators like OBV.
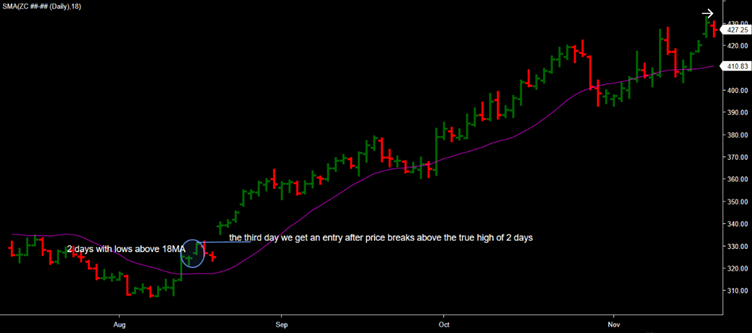
There are a few easy steps traders have to follow for qualified entry:
- There have to be two days with lows above 18MA.
- We want to go long, breaking above the true high of those two days. No breakup–no trade!
- Stop loss is the formation of the opposite signal by the 18-day moving average on the chart.
Pyramiding Your Long Position
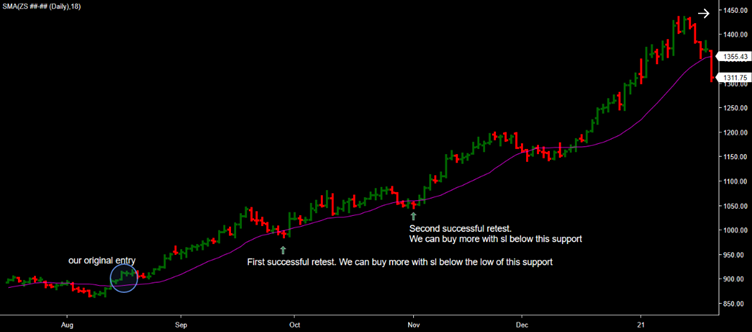
As you see on the chart, the price usually touches 18MA a few times during the run. The first two retests typically represent an excellent opportunity to add more futures contracts and increase your position.
Adding more after the third retest involves a much higher risk; no trend will last forever. The stop loss should be placed below the support zone, as shown on the chart.
Shorting with 18MA
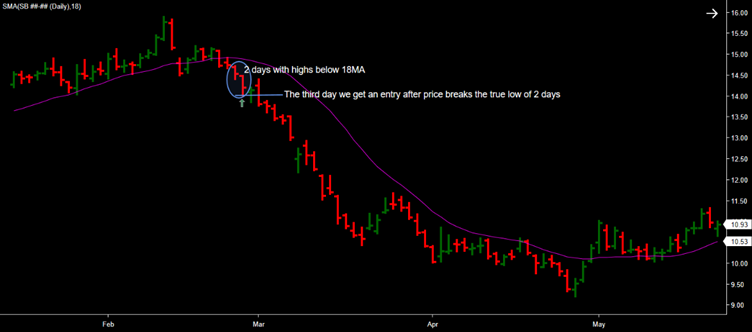
We can use the same approach to short the market. But in this case, we are looking for a distribution that can be confirmed by OBV or Wyckoff pattern. The rules for qualified entry are opposite:
- There have to be two days with its highs below 18MA.
- We want to go short, breaking down the true low of those two days. No breakdown–no trade!
- Stop loss is the formation of the opposite signal by an 18-day moving average on the chart.
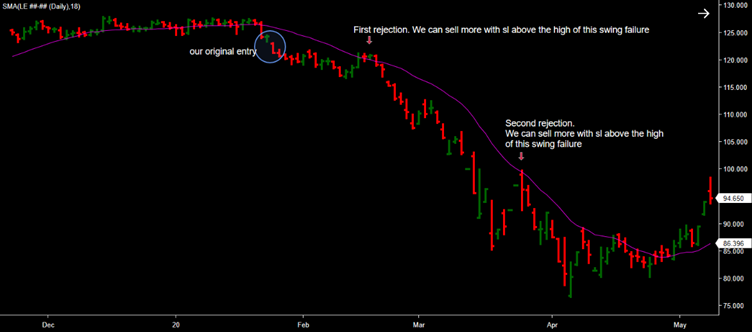
Pyramiding Your Short Position
If the selling pressure is extreme, we might not get an opportunity to add more shorts. However, sometimes we see a less aggressive sell-off and can sell more futures after the price rejects at 18MA. The stop loss should be placed above the high of swing failure, as shown on the chart.
In Conclusion
The 18-day moving average as other MAs makes seeing the trend easier by smoothing chart data out and creating one flowing line.
This strategy is one of the most reliable entries for commodity traders. While this may appear predictive, it is always based on historical data and helps us find better timing for buying or selling. It is advised to follow the strategy only in markets with a fundamental setup for rally or decline.
Learn more about Inna Rosputnia at managed-accounts-ir.com


