

Macro sits at the intersect of policy, the economy and geopolitics, states Bill Baruch, president of BlueLineFutures.com.
It is precisely because of its many variables that there is opportunity across time frames. As different factors get reflected, prices tend to overshoot—yesterday x, today y, and tomorrow it will be z as the "cause". The reality is, however, that markets remain impulsive to variables that may dominate the day's headlines but are close to irrelevant for long-term outcomes.
Distinguishing between noise and signal is paramount when it comes to the validity of an investment thesis, which makes me turn to the recent move in energy markets. With the Crude Oil Index (OVX) near 90 and oil prices at $130, a temporary blowoff top was put in before markets were able to reset and focus on underlying fundamentals. While noise is not our main focus, awareness is extremely important. In order to get a better understanding of it, let's turn to an article from the Financial Times.
Corporate Bond Prices of Commodity Traders | Trafigura, Gunvor, Louis Dreyfus
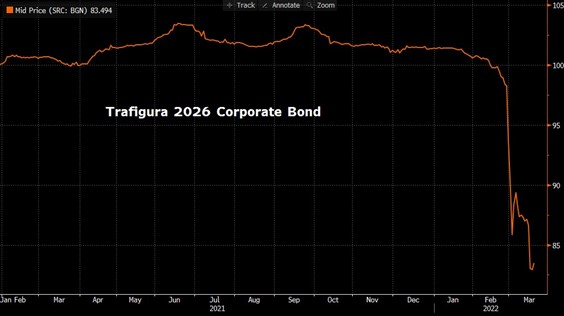
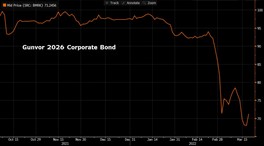

As reflected in the price of the major commodity traders' corporate bonds, volatility has its bearing on the operations of the underlying business. Along the lines of "extremes lead to more extremes," liquidity problems tend to get exacerbated before they settle in. A prime example of how market microstructure can drive prices.
Crude Oil Open Interest | Multi-Year Lows
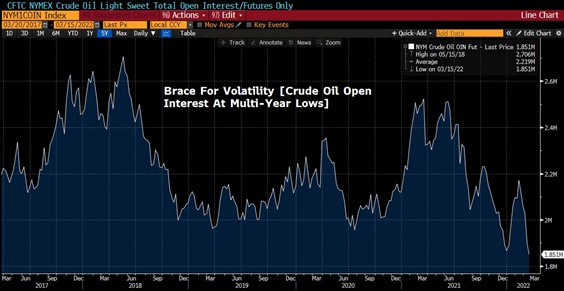
Source: Bloomberg
In the context of Crude Oil and other commodities, it means more volatility and potentially more upside in the midst of a lack of spare capacity and increasing demand. That in turn can result in further unintended consequences, thus more local dislocations. Again, markets remain impulsive and opportunity should remain ample during this fundamental transition to not only renewables, but also added resiliency in global economies.
As Graham and Dodd put it roughly 80 years ago, you want to buy $1 bills for 50cents. It is stunning, however, how price distortions connected to psychology can make that transaction awfully difficult.
Macro Corner
Last Wednesday, the Fed raised interest rates by 25bps and muted market concerns about a 50bps hike. In the short term, that meant risk assets taking comfort in spite of sharp revisions down in the economic growth outlook (2022 GDP growth from 4% to 2.8%) and upward revisions in the committee's inflation forecast (2022 PCE expectations from 2.6% to 4.3%). The same securities that led the 2020 and 2021 rally—tech, high beta, high multiple names—were this week's frontrunners (also got hit hardest.)
Federal Reserve Economic Projections | 03-16-2022
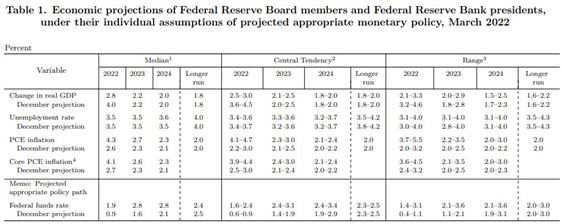
Source: Federal Reserve
To what degree can this theme carry on, however, and are markets ripe to recoup recent losses? In this macro editorial, we've looked at things through a more cautious lens. A slowdown in economic activity combined with a broadening of more sustained inflation pressures should set forth a rather different macro backdrop than what we've been used to (while acknowledging favorable base effects that are going to set in come April).
To the extent that favorable base effects can slow inflation and therefore support a less hawkish Fed, risk assets face a multitude of headwinds:
- Monetary liquidity: With inflation as the number one political issue, monetary stimulus becomes extremely questionable—possibly ruled out for awhile.
- Fiscal support distribution: A shift to fiscal from monetary means that money reaches different people. While monetary accommodation supplies liquidity towards the upper end of households, fiscal stimulus is distributed on the opposite end of the income spectrum. Less wealthy individuals and households are spending their money on goods (upward pressure on prices).
- Deglobalization: Geopolitical developments continue to support resiliency over efficiency; a wave of onshoring resulting in ever-increasing wage pressures combined with higher input costs (margin compression).
- Energy transition: An energy transition in conjunction with less cooperation globally is likely going to lead to domestic efforts that are inevitably inflationary (independence has its costs). A move to renewables comes at a time where new mines have to be developed, new oil fields explored, and new natural gas terminals built.
More likely than not, the baseline looks rather different from what we've been used to. Commodity prices across the board may be in the process of readjusting to a new environment and therefore keeping a lid on economic growth rates going forward (to different degrees at different points in time). Countries around the world are less engaged in global compliance with a common mission between the West & East (more focused on their own self-interest). That means less access, less trade, and a lesser degree of cooperation across trade zones. Additionally, inward orientation has vast implications for the type of fiscal and monetary operations a country is able to implement.
We also have to remember that the post-GFC period was coined by massive amounts of accommodation that increased at every turn we saw minor setbacks in risk appetite. From a "Win-Win" to a "Lose-Lose" environment?
Goldilocks Scenario (Or Lack Thereof) | Real GDP, Core PCE, Fed Balance Sheet
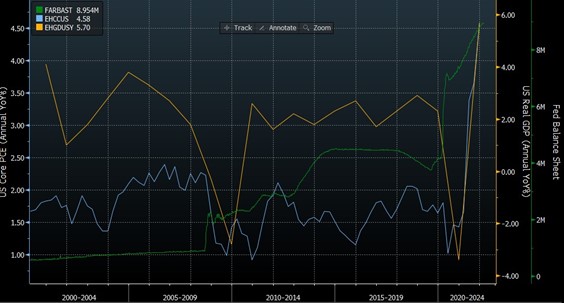
Source: Bloomberg
A goldilocks type of backdrop that we've gotten accustomed to translated into support for risk assets irrespective of conditions in the real economy; as a result, investors got pushed out on the risk curve, investing into future return expectations. Lottery tickets are exciting until the next draw happens, and we may well be due for one.
Nasdaq 100 (IXIC) / S&P 500 (SPX) Index Ratio
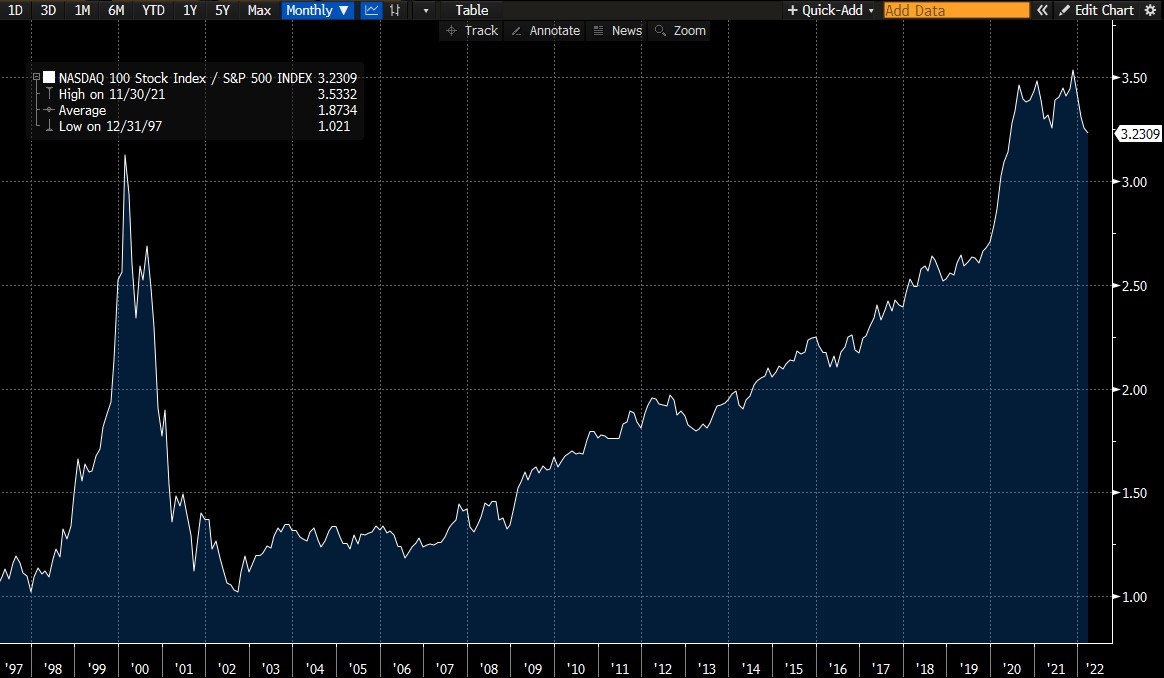
Source: Bloomberg
While creative disruption has been accelerated, there is a stark difference between a good investment and a good price. It is ultimately the price you pay that will make for an attractive IRR.
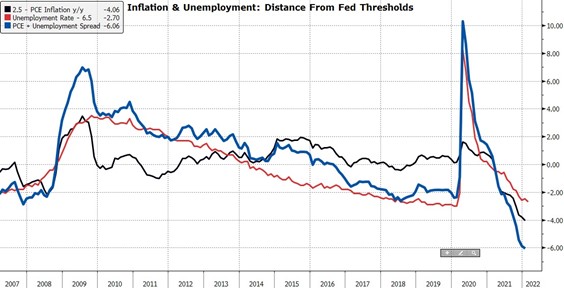
Fed Thresholds
Source: Bloomberg
At What Stage Of The Cycle Are We?
The negative spread indicates that we are far past the Fed's thresholds—indicating the degree to which the FOMC has stayed behind the curve. It is reasonable to see a scenario in which the economy allows them to tighten gradually as inflation base effects kick in (at the same time economic growth will take a hit). An unwillingness to tackle price appreciation could result in a much larger issue, though—stuck between a rock and a hard place.
Time and again, we've pointed to the idea that this is a process in which we will find out where the Fed Put sits and just how addicted markets have become to liquidity. Markets adapt and they can become accustomed over time; however, they do have to rerate accordingly.
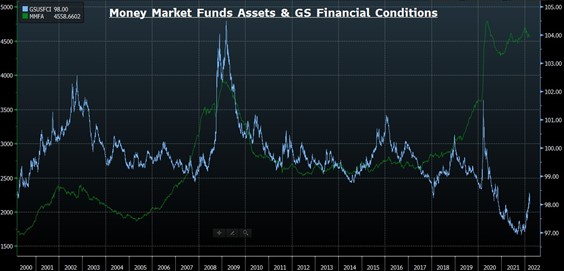
Fed Put And Pivot | Money Market Funds & GS Financial Conditions
Source: Bloomberg
The growth in money market funds illustrates just how relevant the Fed's third mandate of financial stability has become. Despite much catching up to do, it is unreasonable to anticipate Volcker type actions. Yet again, data front-runs everything we are set to see play out on a monetary level—a fast deceleration in economic growth accompanied by a slowdown in inflation may make the Fed less hawkish, but much less able to respond with accommodation when needed.
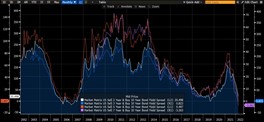
Recession Indicators | 10yr Yield Curves
Source: Bloomberg
10 Year Treasury yield index (TNX) curve spreads have been tightening for quite a while now and continue to point south. On the opposite end, the New York Fed's recession indicator as displayed by the 10yr-3m yield curve is showing no signs of stress.
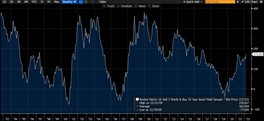
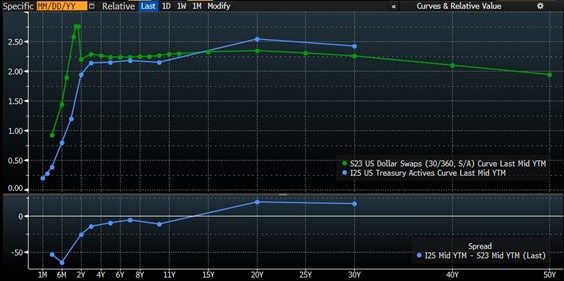
Yield Curve (Current & One Year Forward)
Source: Bloomberg
The forward yield-curve is indicating an inversion across the curve one year out.
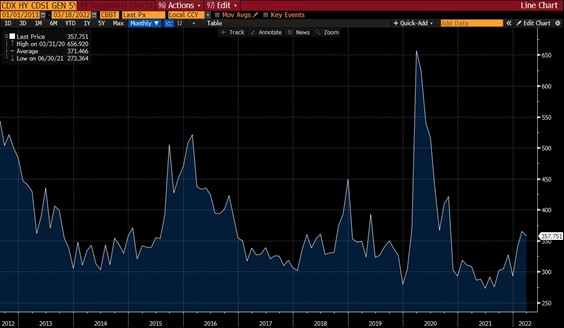
CDX High Yield
Source: Bloomberg
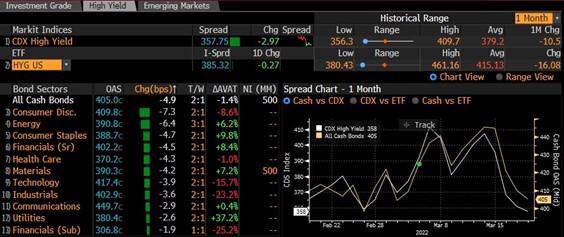
High Yield OAS Across Sectors
Source: Bloomberg
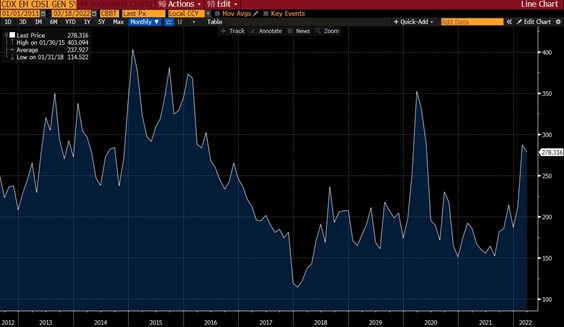
CDX EM Spread (Emerging Market Debt)
Source: Bloomberg
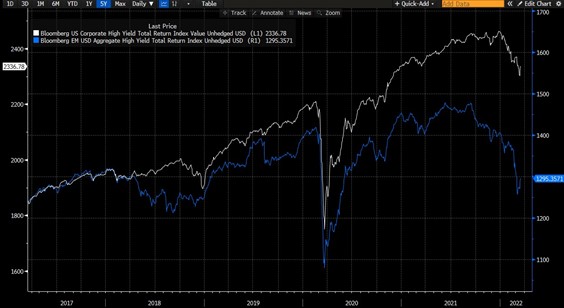
US Corporate High Yield | EM USD High Yield
Source: Bloomberg
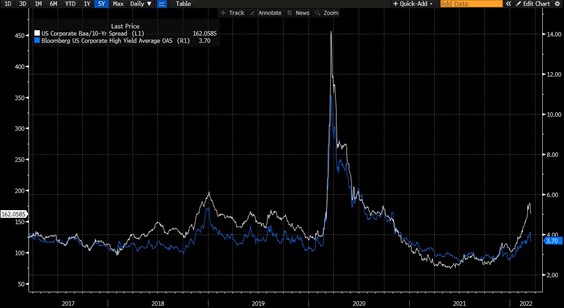
US Corporate Baa-10yr Spread & US Corporate High Yield Average OAS
Source: Bloomberg
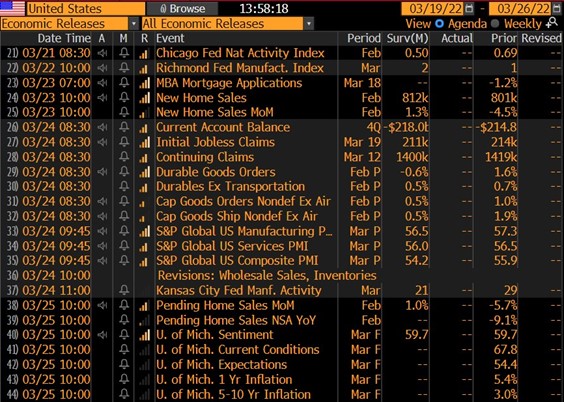
Economic Calendar U.S.
Data Release Times (E.T.)
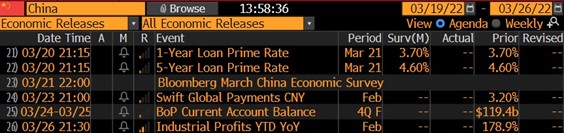
China
Data Release Times (E.T.)
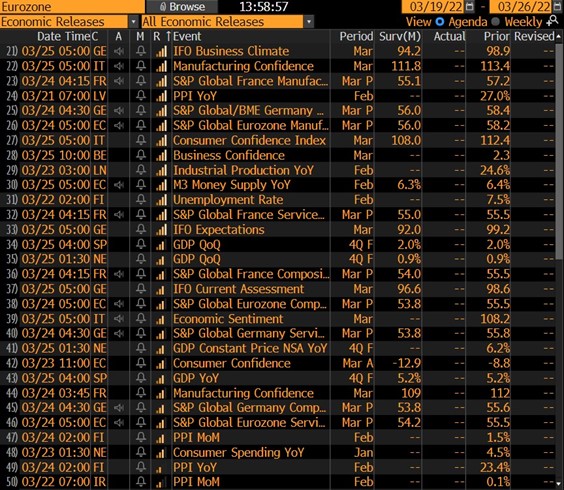
Eurozone (decreasing importance of events from top - bottom)
OPEX - Options Expiration
Market makers come into this upcoming week with a blank piece of paper and relatively less inventory. We will look for early indications of how dealers will be forced to position this time around, offering clues on the next trend after this week's rally from oversold conditions.
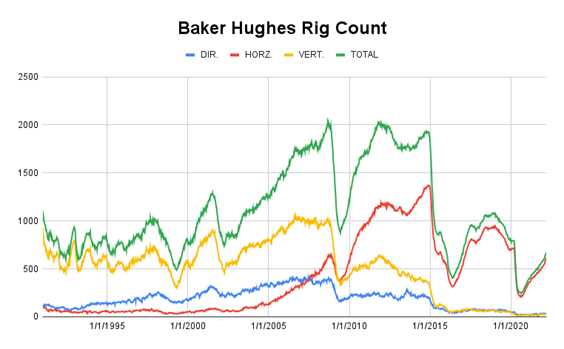
Baker Hughes Rig Count
Source: Baker Hughes
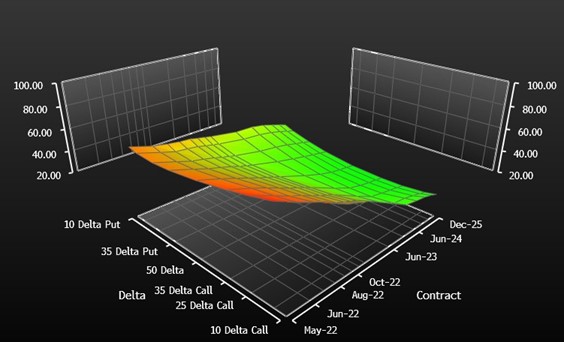
Crude Oil Volatility Surface
Source: Bloomberg
Crude Oil (CL=F) options contracts are call-skewed in the front months while they price in downward risks in the back half of the year. Repricing possible further out.
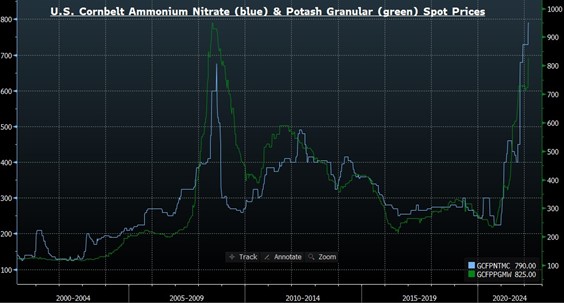
Fertilizer Prices
Source: Bloomberg
China Lockdowns (BNEF reports)
- More than 50% of flights were canceled at the 20 largest airports (Mar 11-17).
- Subway rides have dropped by 60% in Shanghai since the introduction of the lockdown policy.
- In cities such as Beijing and Guangzhou, rides have declined 10-20%.
- Refinery run-rates have dipped to 51% in mid-March.
- BNEF expects refinery runs to remain subdued as lockdown policies show no signs of easing.
- China has lowered crude import and fuel export quotas early in 2022 to secure domestic fuel supply.
- Crude oil imports dropped 5% YoY in January and February.
Earnings
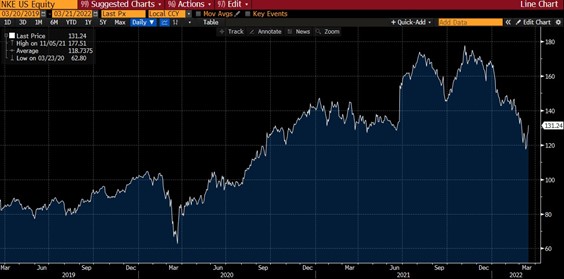
Nike (NKE) reporting after the close on Monday:
- Consensus: EPS est. $0.73; Revenue est. $10.62bn.
Commentary on the following will be monitored:
- Shape of the consumer [consumer spending].
- Input prices and any signs of easing cost pressures.
- Commentary on Russia exposure.
- China Covid lockdowns.
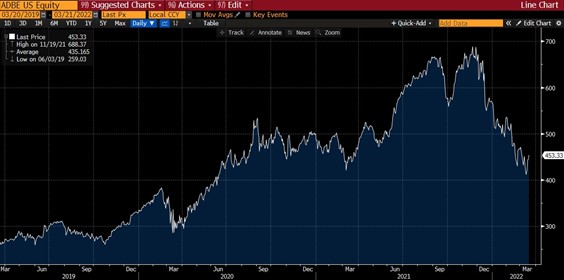
Adobe (ADBE) reporting after the close on Tuesday:
- Consensus: EPS est. $3.34; Revenue est. $4.24bn.
Commentary on the following will be monitored:
- Competitor threats from more intuitive design platforms such as Canva.
- Adobe's incumbent position as the leading creative platform.
General Mills (GIS) reporting before the open on Wednesday:
- Consensus: EPS est. $0.77; Revenue est. $4.56bn.
Commentary on the following will be monitored:
- Cost pressures.
- Wage costs.
- Consumer demand.
KB Home (KBH) reporting after the close on Wednesday:
- Consensus: EPS est. $1.52; Revenue est. $1.49bn.
Commentary on the following will be monitored:
- State of the housing market and current backlog situation.
- Favorable demographics for continued growth.
- Increasing mortgage rates.
Learn more about Bill Baruch at Blue Line Futures.


