
A subscriber asked us recently where he should be putting his money and how to limit losses in his retirement portfolio, notes technical specialist Chris Vermeulen, editor of The Technical Traders.
He expressed frustration as he watched Buffett’s Berkshire Hathaway stock going up, but at the same time, the stock indices going lower and many of his previously favored stocks experiencing substantial losses! This conversation naturally piqued our curiosity. We decided to look into this for him and, at the same time, share our findings with our subscribers.
Berkshire Hathaway stock traded at an all-time record high price of $520,654.46. At a stock price of $512,991, Berkshire’s market capitalization is $756.23 billion. Last year, Berkshire generated a record $27.46 billion of operating profit, including gains at Geico car insurance, the BNSF railroad, and Berkshire Hathaway Energy.
Berkshire vs. S&P 500 Benchmark
Warren Buffett, age 91 (known as the Sage of Omaha), is the chairman and CEO of Berkshire Hathaway. He is considered by many to be the most successful stock investor in the world and, according to Forbes Real-Time Billionaire List, has a personal net worth that exceeds $120 billion USD.
Very few can compete with his long-term track record. Since 1965, Berkshire has provided +20% average annual returns, almost double the +10.2% average annual returns for the S&P 500 Stock Index benchmark. The 2022 year-to-date comparison is: BRK.A Berkshire Hathaway +14.53%; SPY SPDR ETF -6.36%; FB Facebook -35.64%.
However, according to Buffett’s own humility, he has endured years of underperformance and has had his share of bad stock picks. When Buffet was asked about drawdowns at one of Berkshire’s annual meetings, he stated, “Unless you can watch your stock holdings decline by 50% without becoming panic-stricken, you should not be in the stock market.” According to www.finance.yahoo.com, the five biggest percentage losses for Berkshire have been: 1974 -48.7%, 1990 -23.1%, 1999 -19.9%, 2008 -31.8%, and 2015 -12.5%.
What Can We Learn from the Buffett Indicator?
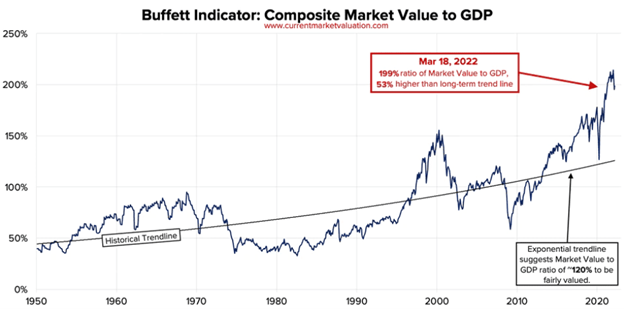
The Buffett Indicator, as dubbed by Berkshire shareholders, is the ratio of the total United States stock market valuations (the Wilshire 5000 stock index) divided by the annual US GDP. The indicator peaked at the beginning of 2022 and remains near all-time highs even though many stocks are well off their record levels.
This historical chart of the Buffett Indicator was created by www.currentmarketvaluation.com. Doing quantitative analysis, we learn that the indicator is more than 1.6 standard deviations above the historical average, which suggests the market is over-valued and, in time, will fall back to its historical average.
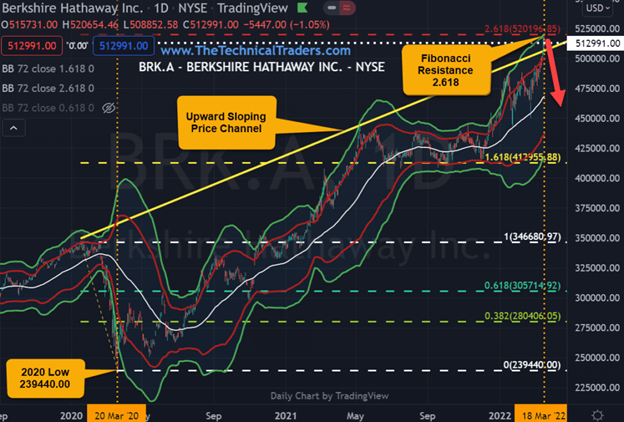
Berkshire Hathaway at Fibonacci Resistance!
On March 18, 2022, Berkshire hit an all-time high price of $520,654. The Fibonacci resistance level of 2.618 or 261.8% of the March 23 low of $239,440 is $520,196. As shown on the daily chart, Berkshire also met resistance at the 2.618 standard deviations of the quarterly Bollinger Band.
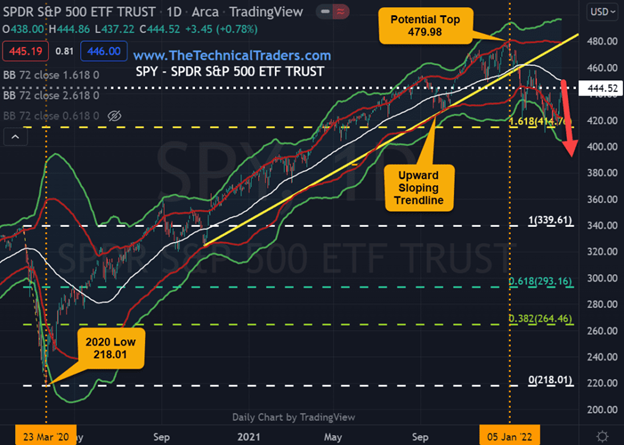
The S&P 500 (SPX) Index is the industry standard benchmark when comparing investment returns. It’s worth noting that as Berkshire reached the Fibonacci 2.618 resistance, the SPY found support at the Fibonacci 1.618 of the SPY March 23, 2020 low.
Central banks have begun to tighten credit by raising interest rates for the first time since 2018, attempting to bring fast-rising energy, food, and housing prices under control. More time is needed to determine the full impact that rising global interest rates will have on current markets.
However, on the chart below, we can see that the SPY put in a major top around 480 and, for the time being, has found support around 420 (the Fibonacci 1.618 level). Considering the increased market volatility and that we are now entering a cycle of higher interest rates, it would not surprise us to see the SPY eventually break below 420.
It is worth noting that when a market makes a top after a prolonged bull market, we usually experience distribution. Distribution with volatility results from large institutions beginning to liquidate their holdings while smaller retail investors are trying to buy stocks on sale. In other words, the retail investors are buying the dip hoping to get a bargain, while the institutional investors are selling the rally hoping to be liquidated and/or go short. It is a battle that retail investors will eventually lose!
It is important to understand we are not saying the market has topped and is headed lower. This article sheds some light on some interesting analyses that you should be aware of. As technical traders, we follow price only, and when a new trend has been confirmed, we will change our positions accordingly. We provide our ETF trades with subscribers to our newsletter, and surprisingly, we have just entered five new trades.