

For today’s trade of the day, we will be looking at a Moving Average Convergence/ Divergence (MACD) chart for United Rentals, Inc. (URI), states Chuck Hughes of TradeWinsDaily.
Before breaking down URI’s MACD chart let’s first review what products and services the company offers.
United Rentals, Inc., through its subsidiaries, operates as an equipment rental company. It operates in two segments, General Rentals, and Specialty. The General Rentals segment rents general construction and industrial equipment including backhoes, skid-steer loaders, forklifts, earthmoving equipment, and material handling equipment; aerial work platforms, such as boom and scissor lifts.
MACD Indicator confirms Price Momentum
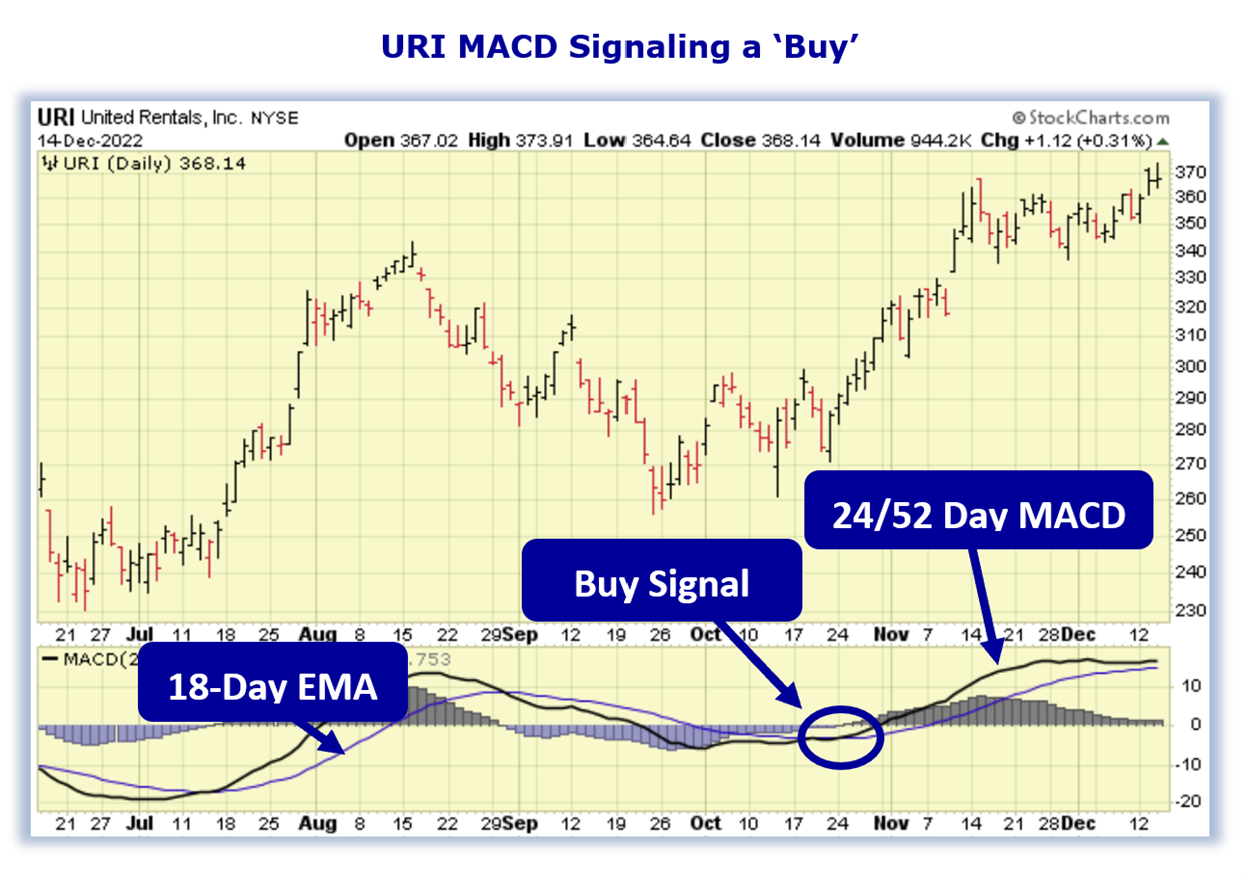
The URI daily price chart below shows that URI is in a price uptrend as the 24/52-day MACD line (black line) is above the 18-Day EMA (purple line). The Moving Average Convergence/ Divergence chart is shown below the daily price chart.
MACD uses moving averages to create a momentum indicator by subtracting the longer-term moving average from the shorter-term moving average. The MACD is calculated by subtracting a stock’s longer-term 52-Day Exponential Moving Average (EMA) from its shorter-term 24-Day EMA. This creates the MACD line.
MACD ‘Buy’ Signal
The 18-Day EMA line functions as a buy/sell ‘trigger’. When the 24/52-Day MACD line crosses above the 18-Day EMA line it indicates positive momentum and higher prices for the stock. When the 24/52 Day MACD lines cross below the 18-Day EMA it indicates negative momentum and lower prices for the stock. MACD is more of a leading indicator than a moving average crossover which tends to lag price movement.
MACD Histogram shows Acceleration of Momentum
Also included in a MACD chart is the histogram bar graph. This portion of the chart helps to illustrate the distance between the 24/52-Day MACD and the 18-Day EMA.
When a crossover initially occurs, the histogram’s bar will be near flat as the two indicator lines have converged. As the lines begin to separate, the bars grow in height, indicating a widening gap and acceleration for the stock’s momentum. When the histogram’s bars begin to shrink this indicates a narrowing of the gap between the 24/52 Day MACD and the 18-Day EMA and a slowing of the stock’s momentum. When the gap between the two indicators begins to narrow, this typically indicates a crossover of the indicator lines could happen soon.
Buy URI Stock
As long as the 24/52-Day MACD line remains above the 18-Day EMA, the stock is more likely to keep trading at new highs in the coming days and weeks. Since URI’s bullish run is likely to continue, the stock should be purchased. Our initial price target for URI stock is 380.00 per share.
Profit if URI is Up, Down or Flat
Now, since URI’s 24/52 Day MACD is trading above the 18-Day EMA and will likely rally from here, let’s use the Hughes Optioneering calculator to look at the potential returns for a URI call option spread.
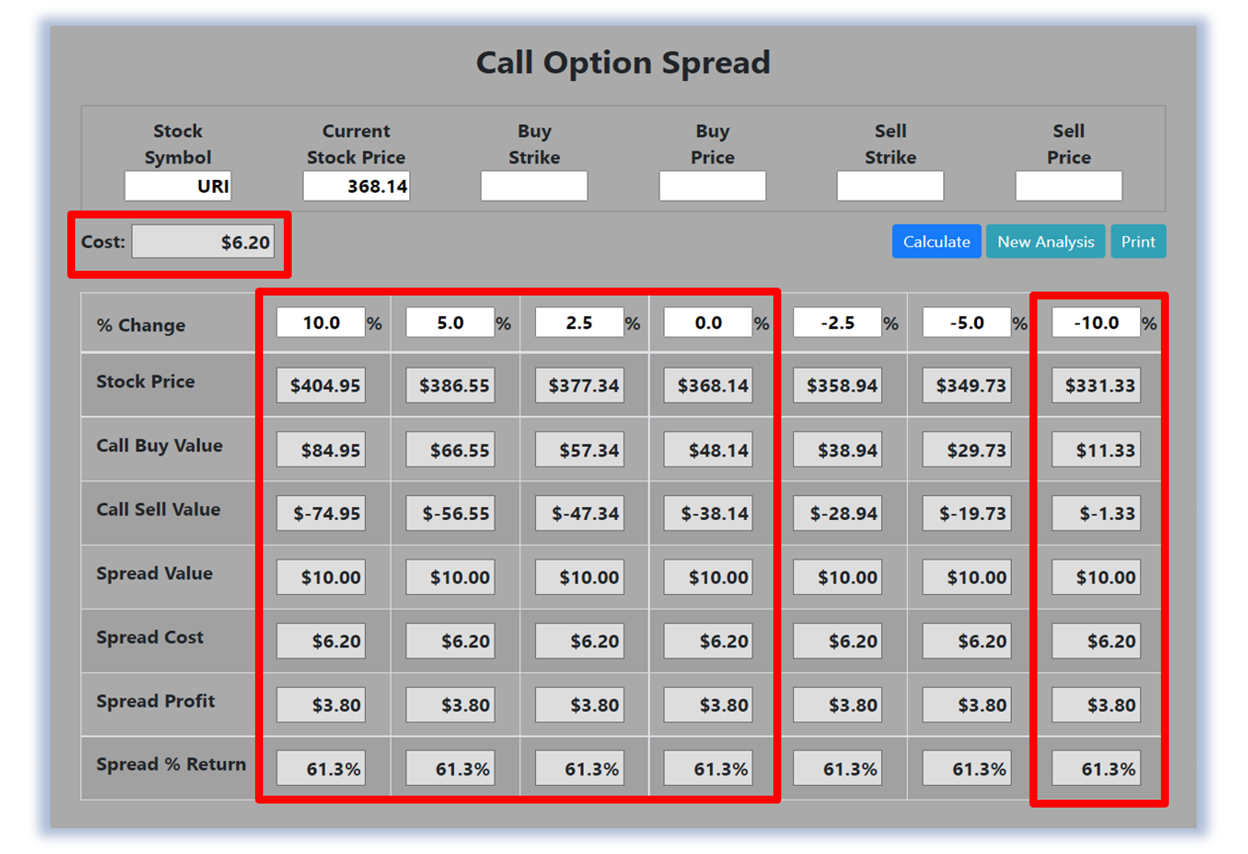
The Call Option Spread Calculator will calculate the profit/loss potential for a call option spread based on the price change of the underlying stock/ETF at option expiration in this example from a 10.0% increase to a 10.0% decrease in URI at option expiration.
The goal of this example is to demonstrate the ‘built-in’ profit potential for option spreads and the ability of spreads to profit if the underlying stock is up, down, or flat at option expiration. Out of fairness to our paid option service subscribers, we don’t list the option strike prices used in the profit/loss calculation.
The prices and returns represented below were calculated based on the current stock and option pricing for URI on 12/14/2022 before commissions.
Built-in Profit Potential
For this option spread, the calculator analysis below reveals the cost of the spread is $620 (circled). The maximum risk for an option spread is the cost of the spread. The analysis reveals that if URI stock is flat or up at all at expiration the spread will realize a 61.3% return (circled). And if URI stock decreases 10.0% at option expiration, the option spread would make a 61.3% return (circled).
Due to option pricing characteristics, this option spread has a ‘built-in’ 61.3% profit potential when the trade was identified. Option spread trades can result in a higher percentage of winning trades compared to a directional option trade if you can profit when the underlying stock/ETF is up, down, or flat. A higher percentage of winning trades can give you the discipline needed to become a successful trader.
Learn more about Chuck Hughes here


