
For today’s trade of the day we will be looking at a monthly chart for Zillow Group, Inc. (Z), states Chuck Hughes of Hughes Optioneering.
Before breaking down Z’s monthly chart let’s first review what products and services the company offers.
Zillow Group, Inc. operates real estate brands on mobile applications and Websites in the United States. The company operates through Internet, Media, and Technology (IMT); Mortgages; and homes segments. Its IMT segment offers premier agent and rental marketplaces. It also offers other services, which include a new construction marketplace, advertising, and business technology solutions, as well as display,dotloop, and floor plans.
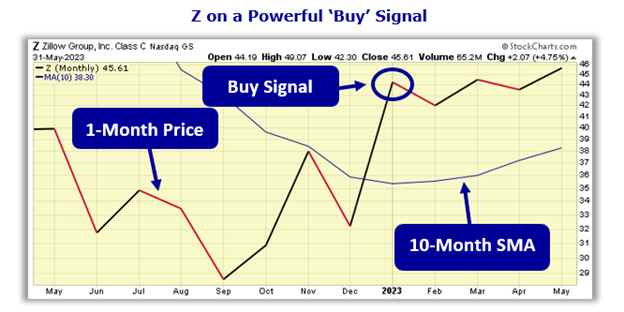
Now, let’s begin to break down the monthly chart for Z stock. Below is a Ten-Month Simple Moving Average chart for Zillow Group, Inc.
Buy Z Stock
As the chart shows, in January, the Z One-Month Price, crossed above the Ten-Month simple moving average (SMA). This crossover indicated the buying pressure for Z stock exceeded the selling pressure. For this kind of crossover to occur, a stock has to be in a strong bullish uptrend. Now, as you can see, the One-Month Price is still above the Ten-Month SMA. That means the bullish trend is still in play! As long as the One-Month price remains above the Ten-Month SMA, the stock is more likely to keep trading at new highs and should be purchased. Our initial price target for Z is 50.00 per share.
85.3% Profit Potential for Z Option
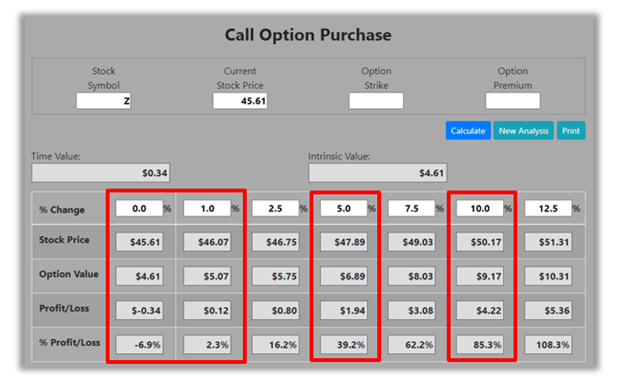
Now, since Z’s 1-Month Price is trading above the Ten-Month SMA this means the stock’s bullish rally will likely continue. Let’s use the Hughes Optioneering calculator to look at the potential returns for a Z call option purchase. The Call Option Calculator will calculate the profit/loss potential for a call option trade based on the price change of the underlying stock/ETF at option expiration in this example from a flat Z price to a 12.5% increase. The Optioneering Team uses the 1% Rule to select an option strike price with a higher percentage of winning trades. In the following Z option example, we used the 1% Rule to select the Z option strike price but out of fairness to our paid option service subscribers we don’t list the strike price used in the profit/loss calculation.
Trade with Higher Accuracy
When you use the 1% Rule to select a Z-in-the-money option strike price, Z stock only has to increase 1% for the option to break even and start profiting! Remember, if you purchase an at-the-money or out-of-the-money call option and the underlying stock closes flat at option expiration it will result in a 100% loss for your option trade! In this example, if Z stock is flat at 45.61 at option expiration, it will only result in a 6.9% loss for the Z option compared to a 100% loss for an at-the-money or out-of-the-money call option.
Using the 1% Rule to select an option strike price can result in a higher percentage of winning trades compared to at-the-money or out-of-the-money call options. This higher accuracy can give you the discipline needed to become a successful options trader and can help avoid 100% losses when trading options.
The goal of this example is to demonstrate the powerful profit potential available from trading options compared to stocks. The prices and returns represented below were calculated based on the current stock and option pricing for Z on 5/31/2023 before commissions. When you purchase a call option, there is no limit on the profit potential of the call if the underlying stock continues to move up in price.
For this specific call option, the calculator analysis below reveals if Z stock increases 5.0% at option expiration to 47.89 (circled), the call option would make 39.2% before the commission. If Z stock increases 10.0% at option expiration to 50.17 (circled), the call option would make 85.3% before the commission and outperform the stock return by more than eight to one. The leverage provided by call options allows you to maximize potential returns on bullish stocks.