

The chart of the day belongs to the software application company AppLovin (APP), states Jim Van Meerten of BarChart.com.
I found the stock by using Barchart's powerful screening functions to find stocks with the highest technical buy signals, highest Weighted Alpha, superior current momentum, and a Trend Seeker buy signal. I then used the Flipchart feature to review the charts for consistent price appreciation. Since the Trend Seeker signaled a buy on 6/26 the stock gained 62.51%.
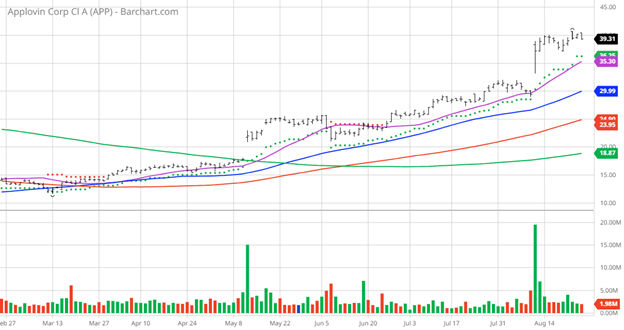
APP Price vs. Daily Moving Averages
AppLovin Corporation engages in building a software-based platform for mobile app developers to enhance the marketing and monetization of their apps in the United States and internationally. The company's software solutions include AppDiscovery, a marketing software solution, that matches advertiser demand with publisher supply through auctions; Adjust, an analytics platform that helps marketers grow their mobile apps with solutions for measuring, optimizing campaigns, and protecting user data; MAX, an in-app bidding software that optimizes the value of an app's advertising inventory by running a real-time competitive auction; and Wurl, a connected TV platform, which primarily distributes streaming video for content companies. Its business clients include various advertisers, internet platforms, and others. The company was incorporated in 2011 and is headquartered in Palo Alto, California.
Barchart's Opinion Trading systems are listed below. Please note that the Barchart Opinion indicators are updated live during the session every 20 minutes and can therefore change during the day as the market fluctuates. The indicator numbers shown below therefore may not match what you see live when you read this report.
Barchart Technical Indicators:
- 100% technical buy signals
- 123.70+ Weighted Alpha
- 48.90% gain in the last year
- Trend Seeker buy signal
- Above its 20, ,50 an100-day moving averages
- 11 new highs and up 39.64% in the last month
- Relative Strength Index 70.60%
- Technical support level at $39.65
- Recently traded at $39.31 with a 50-day moving average of $29.99
Fundamental Factors:
- Market Cap 13.97 billion
- P/E 146.22
- Revenue is expected to grow by 9.50% this year and another 12.70% next year
- Earnings are estimated to increase 244.20% this year, an additional 73.30% next year, and continue to compound at an annual rate of 100.30% for the next 5 years
Analysts and Investor Sentiment—I don't buy stocks because everyone else is buying but I do realize that if major firms and investors are dumping a stock it's hard to make money swimming against the tide:
- Wall Street analysts gave seven strong buys, six buys, nine holds, and one underperform opinion on the stock
- Analysts have a price target of $20 to $57 with a consensus of $41.20
- The individual investors following the stock on Motley Fool voted 20 to three for the stock to beat the market with the more experienced investors voting four to zero for the same result
- Value Line gives the stock its average rating of three
- CFRA's MarketScope rates it a strong buy
- 5.670 investors monitor the stock on Seeking Alpha
Disclosure: I/we have no stock, option, or similar derivative position in any of the companies mentioned, but may initiate a beneficial Long position through a purchase of the stock, or the purchase of call options or similar derivatives in the next 72 hours.
Additional Disclosure: The Barchart Chart of the Day highlights stocks that are experiencing exceptional current price appreciation. They are not intended to be buy recommendations as these stocks are extremely volatile and speculative. Should you decide to add one of these stocks to your investment portfolio it is highly suggested you follow a predetermined diversification and moving stop loss discipline that is consistent with your personal investment risk tolerance and reevaluate your stop losses at least every week.
Learn more about Jim Van Meerten at BarChart.com.


