

The Chart of the Day belongs to the apparel manufacturer Phillips-Van Heusen (PVH), states Jim Van Meerten of BarChart.com.
I found the stock by using Barchart's powerful screening functions to find stocks with the highest technical buy signals, highest Weighted Alpha, superior current momentum, and a Trend Seeker buy signal. I then used the Flipchart feature to review the charts for consistent price appreciation. Since the Trend Seeker signaled a buy on 11 /15 the stock gained 44.99%.
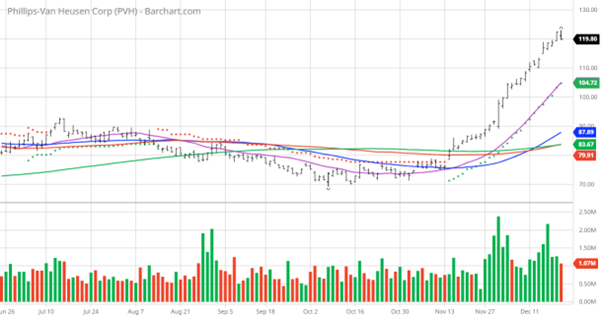
PVH Price vs Daily Moving Averages
PVH Corp. operates as an apparel company in the United States and internationally. The company operates through six segments: Tommy Hilfiger North America, Tommy Hilfiger International, Calvin Klein North America, Calvin Klein International, Heritage Brands Wholesale, and Heritage Brands Retail.
Barchart's Opinion Trading systems are listed below. Please note that the Barchart Opinion indicators are updated live during the session every 20 minutes and can therefore change during the day as the market fluctuates. The indicator numbers shown below therefore may not match what you see live on the Barchart.com website when you read this report.
Barchart Technical Indicators:
- 100% technical buy signals
- 83.93+ Weighted Alpha
- 77.30% gain in the last year
- Trend Seeker buy signal
- Above its 20, 50, and 100-day moving averages
- 20 new highs and up 38.95% in the last month
- Relative Strength Index 85.96%
- Technical support level at $120.18
- Recently traded at $119.50 with a 50-day moving average of $87.92
Fundamental Factors:
- Market Cap $7.30 billion
- P/E 12.63
- Dividend yield .12%
- Revenue is expected to grow 1.40% this year but decrease by .20% next year
- Earnings are estimated to increase by 16.60% this year, grow again by 13.40% next year, and continue to compound at an annual rate of 12.62% for the next 5 years
Analysts and Investor Sentiment: I don't buy stocks because everyone else is buying but I do realize that if major firms and investors are dumping a stock it's hard to make money swimming against the tide:
- Wall Street analysts issued six strong buy, five buy, and seven hold recommendations on the stock
- Analysts' price targets are between $80 and $158—despite positive recommendations the average price target is $113 which is about 6% below today's price
- The individual investors following the stock on Motley Fool voted 209 to 27 for the stock to beat the market with the most experienced investors voting 49 to three for the same result
- Value Line gives the stock an above-average rating of two but has an 18-month price target of $92—which is about 25% below today's price.
- CFRA's MarketScope gives the stock a four-star strong buy recommendation but has a price target of $125 only 2% above today's price—a four-star buy for only 2%?????
- 13,080 investors monitor the stock on Seeking Alpha
Special Note: With all the professionals having strong buy and buy recommendations does it make sense that their price targets are below today's price??? This is a good reason why you should do your research and think for yourself
Additional Disclosure: The Barchart Chart of the Day highlights stocks that are experiencing exceptional current price appreciation. They are not intended to be buy recommendations as these stocks are extremely volatile and speculative. Should you decide to add one of these stocks to your investment portfolio it is highly suggested you follow a predetermined diversification and moving stop loss discipline that is consistent with your personal investment risk tolerance and reevaluate your stop losses at least weekly.
Learn more about Jim Van Meerten at BarChart.com.


