

The S&P 500 just registered its second down week in a row after hitting an all-time high as recently as February 19. Meanwhile, US Treasury yields dropped five weeks in a row, which is even more telling, notes Ivan Martchev, investment strategist at Navellier & Associates.
Even with the all-time high set in February, we ended with a down month. Most of the damage was done in the last seven trading days of the month, flipping the index from positive to negative for February. The most positive thing we can say about February is that we finally had the first rising Friday of the Trump Administration – after experiencing five negative Fridays in a row prior to that.
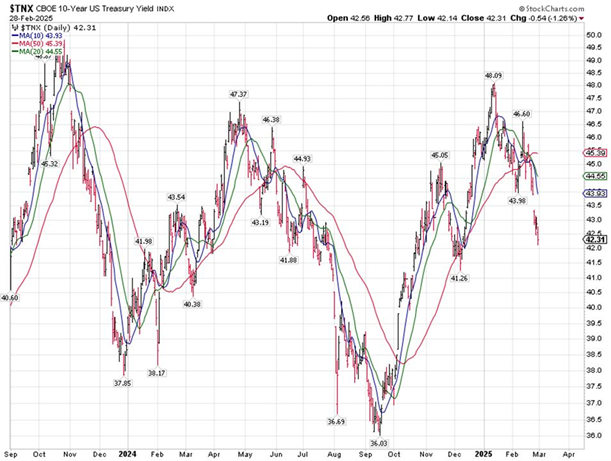
As for the 10-year Treasury Note, its yield has now declined almost 60 basis points from its January high. Individual investors don’t follow bonds as closely as stocks. But to a bond trader or institutional investor, this move in Treasuries is similar to the stock market moving 5%.
This sharp drop in Treasury yields is causing a yield curve inversion to some short-dated Treasury notes. While the famous 2-year/10-year spread is not inverted yet (3.99% vs. 4.24%), the 3-month is inverted, as the 3-month note yield (4.32%) is now higher than the 10-year note. A deeper inversion of those spreads, particularly if the 2-year inverts, will signify that an economic slowdown is worrying the bond market.
While Treasuries may be rallying, and their yields may be falling, in some sort of mild burst of panic, riskier bonds are more or less yawning at the mild investor panic. Single-B rated junk bonds show spreads to relevant Treasuries of 2.81%.
For comparison, during a time of greater worry among bond investors last summer, those spreads were near 3.8%. Anything below 4% on the single-B spread, which bond traders call “inside 400” (basis points), is considered a sign of a healthy economy and not a reason to worry.


