

Sure, we’re seeing plenty of volatility in the STOCK market. But wild swings and big moves aren’t just confined to equities anymore.
Take a look at my MoneyShow Chart of the Day, which shows the Merrill Lynch Option Volatility Estimate Index – or “MOVE” for short. While the CBOE Volatility Index (VIX) tracks vol in the S&P 500, the MOVE index tracks vol in the market for options on Treasury notes and bonds.
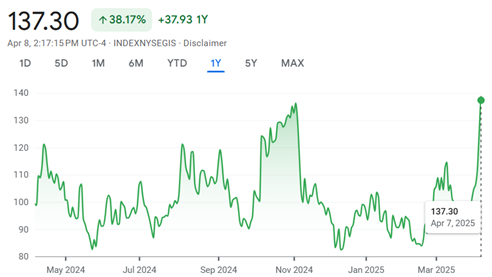
Source: Google Finance
Sure enough, the MOVE index just spiked above 137. That puts it at the highest level in 23 months. Or in other words, bond yields and bond prices are caught up in the tariff-driven chaos, too.
Then consider this bonus chart from Bloomberg. It shows volatility in the foreign exchange (FX) market, using data from JPMorgan Chase & Co. You can see that currency market vol is also hitting levels not seen since early 2023.
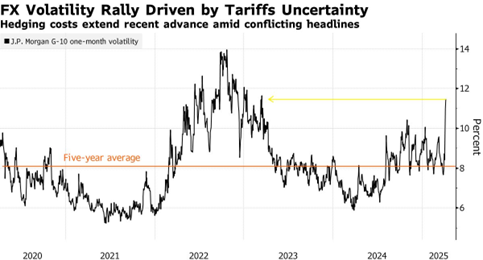
Source: Bloomberg
For investors, the implication is clear: Market swings are getting more violent across all major asset classes. That can create new opportunities if you’re a nimble trader. But it also raises the risk of major losses, particularly if you’re using higher levels of leverage. Size your positions accordingly.


