

One chart can’t get out of its own way. One looks much more compelling. And the funny thing is...they’re BOTH in the same sector!
Energy is the industry I’m taking about – and the MoneyShow Charts of the Day show WTI Crude Oil Futures and US Natural Gas Futures.
WTI Crude Oil Futures
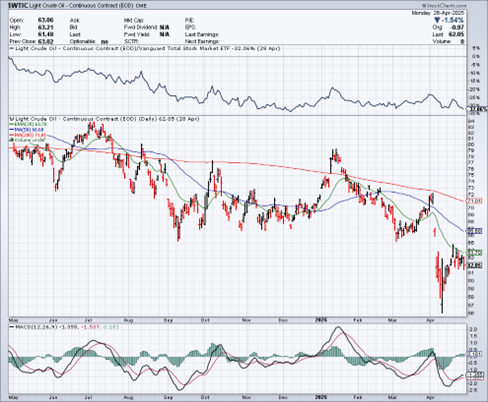
Source: StockCharts.com
You can see here that crude oil prices traded sideways-to-lower for the better part of the past year. Then in April, they got crushed by the Trump Administration’s tough tariff talk.
The assumption? Global trade and economic activity would tank, driving demand down for the petroleum and oil-based products that fuel it. For its part, the World Bank just forecast that global energy prices would fall 17% in 2025 and another 6% in 2026.
Natural Gas Futures
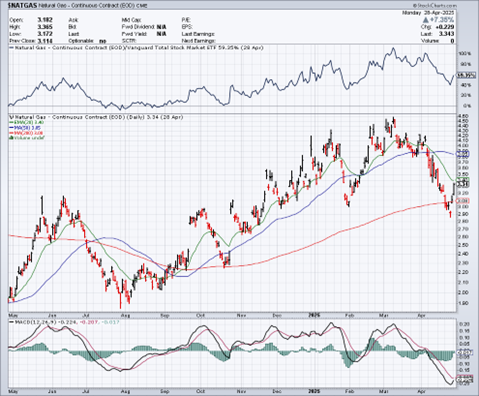
Source: StockCharts.com
As for natural gas? It traded mostly higher starting last August. While gas prices took a hit in April along with almost everything else, they were still hovering in the $3.30 area earlier this week. That was up about 56% year-over-year.
Weather helped drive those gains. But the bigger story is strong global demand for US gas exports. More US production is being shipped to export terminals, supercooled, and transported overseas as Liquefied Natural Gas (LNG). That’s helping bring domestic prices more in line with higher prices common in other parts of the world.
I’m no energy specialist. But I speak and interact with a lot of the MoneyShow experts who are.
They see continued potential in US gas and related equities vis-à-vis oil and oil stocks. And the charts certainly agree! That’s something to keep in mind if you’re trying to decide where and how to trade energy.


