

Figuring out this economy is HARD. And also…soft!
That’s one of the key messages I’m sharing at the MoneyShow MoneyMasters Symposium Miami later this week. And it’s one I’ll give you a “sneak peek” at here.
Check out this double-dose of MoneyShow Charts of the Day. The first shows the Conference Board’s present situation and expectations indices, both of which are found in the group’s monthly consumer confidence report. The second shows the monthly change in nonfarm payrolls from the Labor Department going back one year.
Chart 1: “Soft” Data
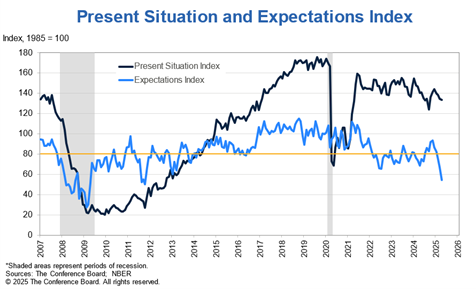
Chart 2: “Hard” Data
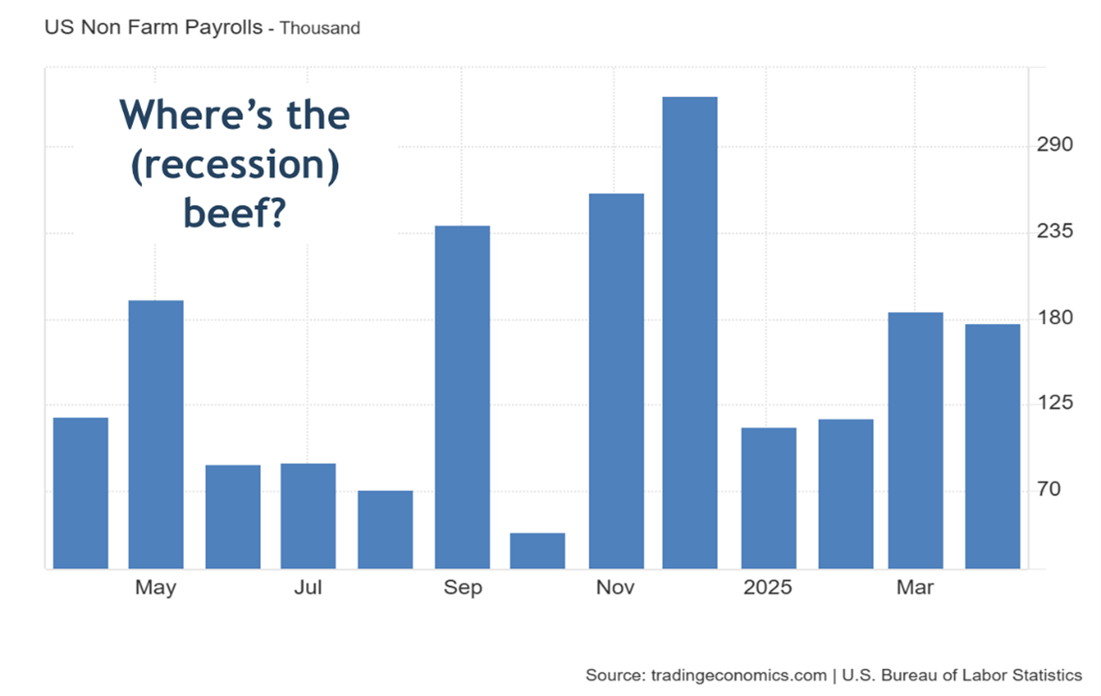
There are two kinds of economic data followed by traders on Wall Street. “Soft” data is based on surveys of investors, business owners, and consumers. It shows what they THINK and SAY. “Hard” data shows what they’re actually DOING.
We’re at an interesting juncture where the soft data looks downright ugly. Consumers say they’re as negative about the future as they’ve been in more than a decade. They’re not very upbeat about the present, either.
But the hard data isn’t falling off a cliff. They’re still spending. As a result, businesses aren’t seeing sales implode...or resorting to massive, across-the-board layoffs. Recessions lead to NEGATIVE monthly payroll readings that total tens of thousands – or even hundreds of thousands – of jobs!
Bears will tell you it’s just a matter of time. That falling sentiment NOW will mean less spending, manufacturing activity, and hiring LATER. But if the tariff and trade saga settles down – as it started to do in the last several days – then confidence could rebound. And the feared “hard data dump” might never happen.
Throw in the wildly negative sentiment on Wall Street – which I repeatedly wrote could lead to a market bottom – and that’d be the kind of thing to fuel more gains. Keep it in mind if you’re trading stocks here!


