

There is ONE stock that has been all over my social media feeds, the financial press...and yes, even our own newsletters…this week.
It’s a name almost everyone owns either directly or indirectly given its role in the indices. It’s worth $3.4 TRILLION, give or take. And it just released first-quarter results.
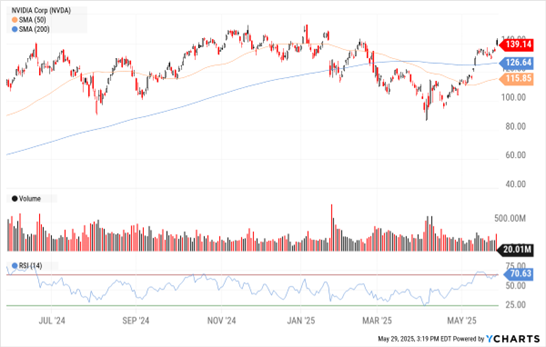
So, yes, I AM going to talk about it. The name, of course, is Nvidia Corp. (NVDA)!
Data by YCharts
But I’m not going to share deep-dive fundamental analysis or parse the firm’s earnings statement and conference call. Several of our experts already spoke about the “big picture” for NVDA at our Miami Symposium. Plus, you may have seen George Gilder of Gilder’s Technology Report call it significantly undervalued near the April lows HERE.
Instead, I’m going to use NVDA as my MoneyShow Chart of the Day. And when I step back and look at the trading activity over the past year, do you know what I see? A lot of sideways chop.
Yes, you could trade the name from the long side during rallies – or the short side during declines – on shorter-term and intermediate-term timeframes. But I can’t tell whether this is a “broken” stock or not in the long-term from the chart alone.
I AM encouraged by the powerful move off the April lows. I DO like the extremely high-volume bottoming action from several weeks ago. But we really NEED to clear old resistance around $150-$152 before getting excited about a fresh, major leg up.
And yes, I’d say that whether this was a chart of Horse & Buggy Inc…OR the biggest semiconductor and Artificial Intelligence (AI) bellwether in the Invesco QQQ Trust (QQQ)!


