

With all the tariff fights going on in Washington, in foreign capitals, and in courtrooms, it’s easy to forget about the Fed. But as a trader, you shouldn’t!
The latest inflation data came out on Friday – and it was right up the bulls’ alley. The core Personal Consumption Expenditures (PCE) index rose just 2.5% year-over-year in April. That was down from 2.7% in March. The headline index that includes food and energy slipped to just 2.1%...within spitting distance of the Fed’s long-term target of 2%.
Yes, it’s possible President Trump’s tariffs will put upward pressure on inflation. That’s one reason the Fed has been sitting on its hands lately. It wants to see if the data confirms that. But SO FAR, the "declining inflation" trend we’ve seen since mid-2022 hasn’t been derailed.
That’s why I’m sharing this CME FedWatch table as my MoneyShow Chart of the Day.
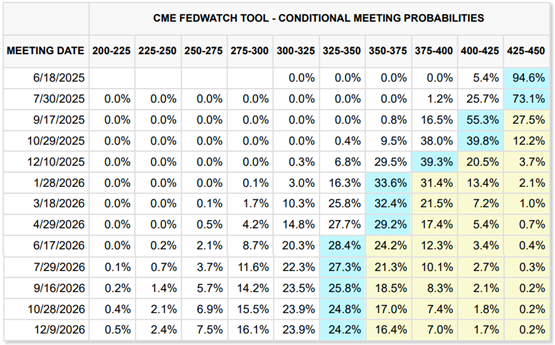
See the light blue boxes? That’s where rate futures traders are pricing in the highest probability of the federal funds rate being on various dates. Those dates are the ones each Fed meeting concludes in the coming year-and-a-half.
As of the end of last week, virtually no one expected the Fed to cut rates from the current 4.25% - 4.5% range at the meeting that ends in mid-June. Traders were only pricing in a 1-in-4 chance of a cut at the end of July.
But markets ARE increasingly pricing in a 25-basis point cut in September. Plus, they’re looking for another couple of cuts in late 2025 and early 2026.
If there’s one thing Wall Street likes, it’s cheaper money. And interest rate markets are suggesting that’s coming. Keep it in mind if you’re deciding whether to trade or fade the move off the April lows!


