

The most notable development here is that my utilities signal flipped to “risk off,” meaning that both of my short-term signals are now indicating caution. It’s worth paying attention when this happens, especially when it flies in the face of the current market narrative, writes Michael Gayed, editor of The Lead-Lag Report.
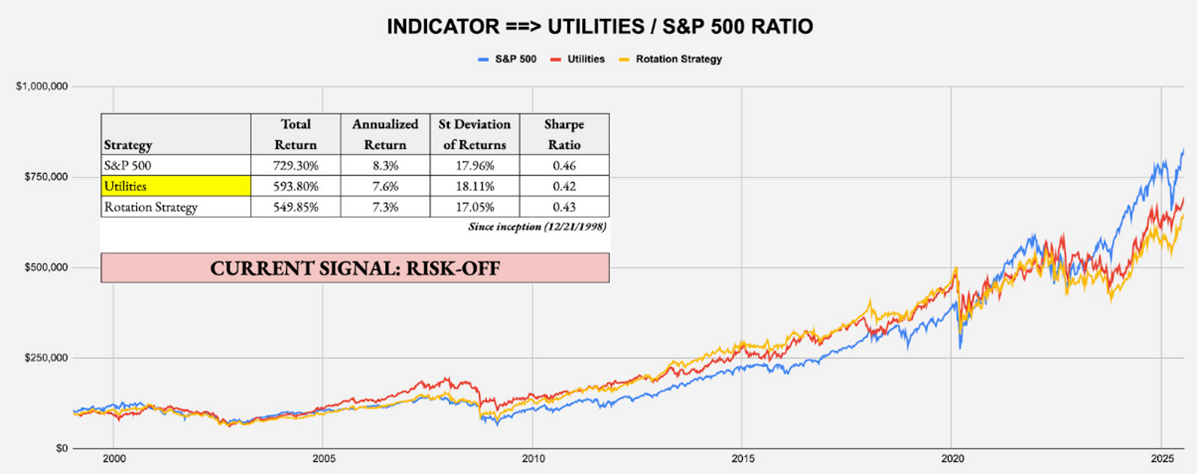
SHORT-TERM SIGNAL: UTILITIES/S&P 500 RATIO
Target Investor: Short-term traders with a higher risk tolerance interested in using an equity momentum strategy to anticipate changes in market risk tolerance.
Current Indicator: Risk-Off
Strategy: Beta Rotation - Example: Invest in the Utilities Select Sector SPDR ETF (XLU) over the SPDR S&P 500 ETF Trust (SPY)
SHORT-TERM SIGNAL: LONG DURATION/INTERMEDIATE DURATION TREASURIES RATIO
Target Investor: Short-term traders with a higher risk tolerance who want to use the activity in the US Treasury market to judge overall risk levels.
Current Indicator: Risk-Off
Strategy: Tactical Risk Rotation - Example: Invest in the Vanguard Long-Term Treasury Index Fund (VLGSX) over SPY
Both the S&P 500 Index (SPX) and Nasdaq 100 have been continuing to set all-time highs, but two of the market’s true risk-off assets are indicating that it might be time to take your foot off the gas. Which one is right?
In reality, the market has been shifting to a more neutral tone for weeks. Value is keeping up with growth. Low vol is keeping up with high beta. Small-caps are even starting to look better here.
With the exception of gold, which has been consolidating its 2025 gains, several defensive asset classes have either been keeping pace with or outperforming their riskier counterparts for several weeks. Market volatility may be relatively calm, but there do seem to be some shifts happening beneath the surface.


