

Forget that outdated maxim “The bigger they are, the harder they fall.” In this market, it’s more like “The smaller they are, the harder they RALLY!”
Just look at the MoneyShow Chart of the Day. It compares the three-month performance of the SPDR S&P 500 ETF (SPY), the iShares S&P 100 ETF (OEF), the iShares Russell 2000 ETF (IWM), and the iShares Micro-Cap ETF (IWC).
SPY, OEF, IWM, IWC (3-Mo. % Change)
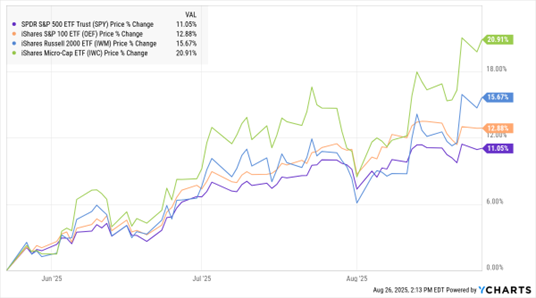
Data by YCharts
You know the SPY. As for the OEF, it tracks the 100 largest-capitalization companies in the S&P 500 – with an average market cap of $891 billion, according to Morningstar. The comparable market cap figure is just $2.58 billion for IWM, and only $568 million for IWC.
So, what does the chart make clear? Despite their pint-sized market caps, smaller stocks are now leading the way!
While the OEF is up a respectable 12.8% year-to-date...the IWM is up 15.6%...and the IWC is up 20.9%. OEF is still “winning” on a year-to-date basis. But the performance gap is shrinking quickly.
What’s driving the action? Part of it is investors looking for new leadership after focusing on big-cap tech for so long. But the Federal Reserve is a key factor, too. All else being equal, Fed rate cuts/cheaper money tend to help smaller cap stocks more than large cap ones.
Bottom line: If you’re looking for new places to invest, don’t think big. Think SMALL!


