

The S&P 500 Index (^SPX) rallied Thursday, despite the release of soft ADP private payrolls and weekly jobless claims data. The SPX futures chart still paints an overall bullish picture, but price action in the last few days hasn’t been great, notes Fawad Razaqzada, technical analyst at Trading Candles.
The buying in the previous session was led by heavyweight technology stocks, with sentiment buoyed by the perception that the Federal Reserve may be edging closer to a September rate cut. But the follow-through action in the wake of today’s non-farm payrolls report will be important to watch.
Things have turned a bit muddy after the index broke its short-term trend line during Tuesday’s drop, which gave rise to follow-up technical selling before dip-buyers stepped in right at 6,370 support. The index has now arrived at a potential resistance zone circa 6,470, which marks a prior support and resistance area and the underside of the broken trend line. The bulls will need to reclaim this level convincingly on a daily closing basis if we are to see a push firmly beyond 6,500 in the coming days.
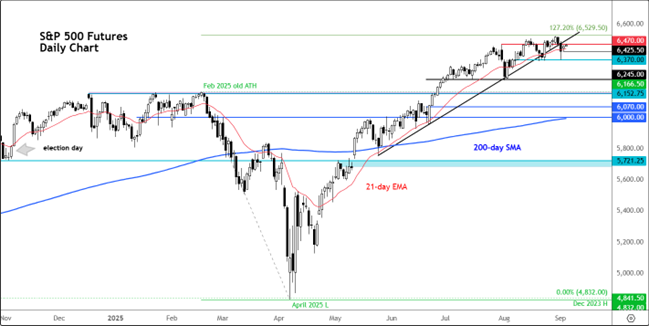
Looking at the shape of the candlestick patterns, there is an inside bar formation on the daily time frame. Given the location of the inside bar pattern – just beneath the trend line – and taking into account the recent loss of bullish momentum, one has to be extra careful when trading on the back of it. In the event of a mini-correction, we could see a decent bounce off the old record high around 6,150-6,166.
On the upside, there is not much resistance beyond the aforementioned 6,470 and 6,500 levels, given that we are trading not too far off the recently achieved record high. Round handles like 6,500 and 6,600 – and Fibonacci extension levels such as 6,530 – are among the upside targets.


