

In less than a week, the US government could face a funding gap. But should investors worry? Let’s unpack the relationship between government shutdowns and the performance of the S&P 500 Index (^SPX), writes Lucas Downey, co-founder of MoneyFlows.
There’s always something to worry about with markets. Wars, interest rates, inflation, and more have pressured investor psyches over the years. But being equipped with cold hard data is a weapon during uncertain times. So, we’ll look to history for guidance on what to expect during and after government shutdowns.
Back to late-1978, we located 16 government shutdowns. Looking at recent history, I’ve plotted the last three government shutdowns over the S&P 500 – Sept. 30, 2013…Jan. 19, 2018...and Dec. 21, 2018.
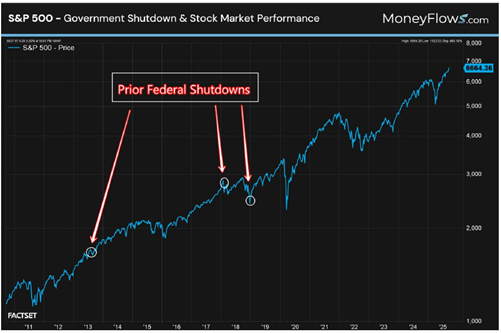
To the naked eye, it appears that these brief moments in history haven’t meant the end of the world. And that’s correct! In fact, government shutdowns have been a rather bullish setup.
Since 1978, here’s how the S&P 500 has performed during and after a government shutdown:
- The average time during a shutdown is 12.5 days. Stocks produce an average 0.8% gain during the actual shutdown
- One month after a shutdown, stocks gain 2.1% on average
- Three months later, markets jump 4.2%
- Six months later, equities climb 9.7%
- Twelve months later, stocks gained 15 out of 16 times, with average gains of 16%
If you’re skittish right now, don’t let it be because of a federal funding gap. Historically, it’s been a great time to buy any pre-shutdown selloffs. Just make sure you’re betting on stocks loved by institutions and growing their sales and earnings. Those are the types of stocks that are thriving in 2025.


