

Following some recent weakness, we saw a good recovery Wednesday in risk assets, leaving the major indices with bullish-looking price candles. Let’s take a look at the technical picture of the S&P 500 Index (^SPX), which shows an overall bullish structure, observes Fawad Razaqzada, technical analyst at TradingCandles.
The S&P 500 futures chart bounced right where it needed to. As you can see from the S&P 500 futures daily chart, the area between 6,722 to 6,765, marks the prior breakout region. In addition to that, the 210-day exponential average also comes into play here.
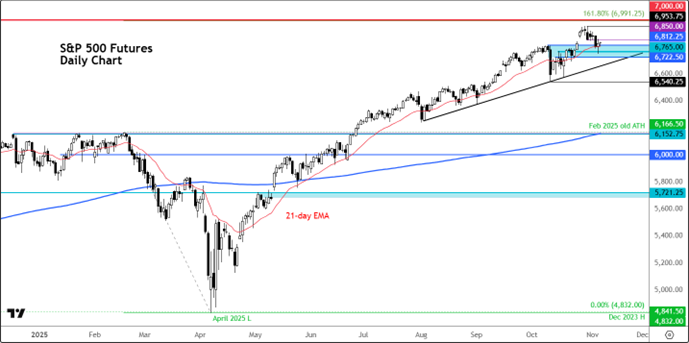
So, the index needed to hold above here to maintain a bullish bias, and judging by Wednesday’s bounce, it looks like the bulls have held their own. We will now need to see some upside follow-through. If the index can now clear 6,850 resistance, then a revisit of the all-time high at 6,953 could be on the cards.
Above that? Well, there is the 161.8% Fibonacci extension level at 6,991. This is derived from the last significant downswing that took place between February-April. Slightly higher, you have the psychologically important 7,000 level next, which is where I expect the index to get to in the coming days.
But in the event the selling resumes first, then that could open the way towards the next support at 6,722 and then the trend line seen slightly lower at around 6,665. But my base-case, short-term scenario is that the market will want to push higher.


