

We just marked the start of the last two weeks of December, which investors closely watch due to a well-documented seasonal pattern known as the “Santa Claus” rally. Historically, stock indices such as the S&P 500 Index (^SPX) tend to rise during the final trading days of December and the early part of January, observes Lance Roberts, editor of the Bull Bear Report.
Over the decades, this period has shown positive returns around 75%-80% of the time, with average gains in the Santa Claus window exceeding those of typical random weeks, about 1.4% on average. The trend, as shown, is strongest in the second half of December as professional managers begin to “window dress” for year-end reporting. They are also helped by lighter trading volumes.
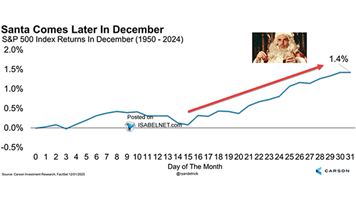
Of course, there are always reasons why such a rally may not occur, but that is why the 1.4% is an “average.” What could go wrong? Several risks could upset the trend:
- Unexpected economic data or a surprise Federal Reserve policy shift due to stronger-than-expected economic data or inflationary pressures.
- Geopolitical events that trigger risk-off trading.
- Profit taking at record highs as 2025 markets have already run strongly.
- Volatility from tech or macro shocks that overwhelm typical seasonal flows.
In other words, seasonality provides context but not trading certainty. And while historical patterns help frame expectations, they do not guarantee outcomes. As a trader, consider trimming extended positions, avoiding new high-beta buys, and watching out for low-volume traps here.


