

Volatility has increased with the failure once again of the S&P 500 Index (^SPX) to clearly break out to new all-time highs. In fact, the largest change in indicator direction has been in the implied volatility complex – the CBOE Volatility Index (^VIX) and its various components, observes Lawrence McMillan, editor of Option Strategist.
The SPX last made a marginal new intraday high on Jan. 28. SPX continued to probe those highs and then fell back. That established resistance near 7,000. At that point, selling accelerated, taking SPX down to 6,780 at the close on Feb. 5, from where it has bounced strongly.
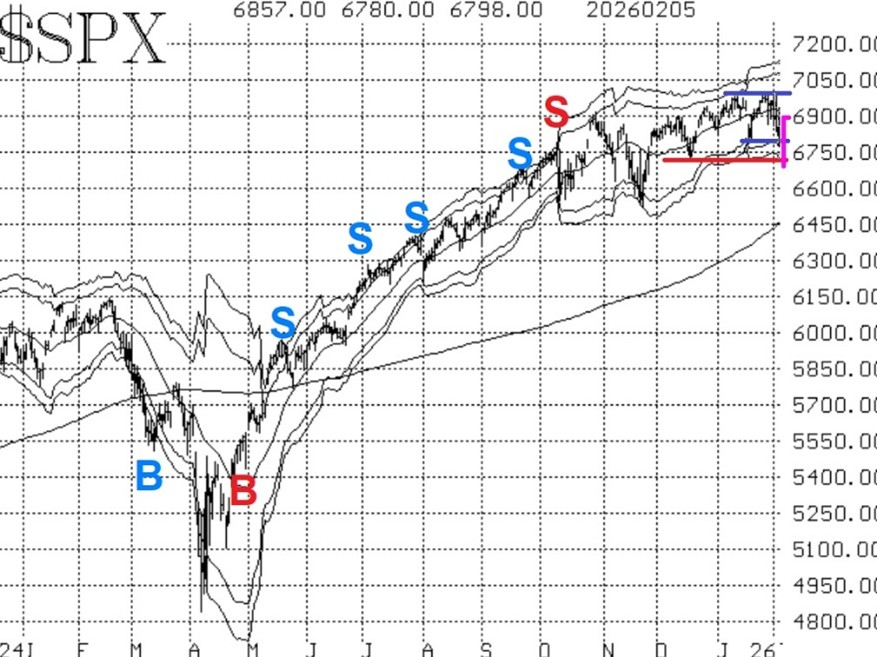
So, the January lows at 6,800 were broken, but not by much. One could still say that 6,780-6,800 is a support level. What is also important, though, is that if that support at 6,720 gives way, then a truly bearish scenario would unfold.
As for VIX, it rose from 14 in late December to a high above 23 last week. Even so, it did not reach “spiking” mode until Feb. 5. It is possible for stocks to decline sharply while VIX is in spiking mode. But eventually a new spike peak buy signal will occur when VIX closes more than three points below its spike peak high.
In summary, things are really quite mixed right now. At one point last week it seemed that the bears had yet another chance to take control. They have not, and now it seems that the bulls are ready to roll. But we know they haven't been able to push SPX above 7,000 meaningfully. So, we'll just let our indicators play out and take confirmed signal trades as they occur.


