

Fresh attacks on shipping vessels and Iran’s new supreme leader vowing to keep the Strait of Hormuz closed have pushed oil near $100 per barrel and stock markets to three-month lows, triggering the December Low Indicator on both the Dow Industrials and S&P 500 Index (^SPX), highlights Jeff Hirsch, editor-in-chief of the The Stock Trader’s Almanac.
The December Low Indicator has been featured in the Stock Trader’s Almanac for years. Originated by Lucien Hooper, a Forbes columnist and Wall Street analyst back in the 1970s, the December Low Indicator is based on the Dow closing below its December Closing Low in the first quarter of the New Year. DJIA’s December closing low was 47,289.33 on Dec. 1.
(Editor’s Note: Jeff is speaking at the 2026 MoneyShow Masters Symposium Hollywood Florida, scheduled for April 9-11. Click HERE to register).
When the market closed below its December Closing Low in the first quarter of a year, the market dropped, on average, another 13.5% on the S&P 500 and 10.9% for DJIA. Now that the December Low Indicator has been triggered on both DJIA and S&P 500, some caution is in order.
What about the war? How has the S&P 500 performed during past wars and energy crises?
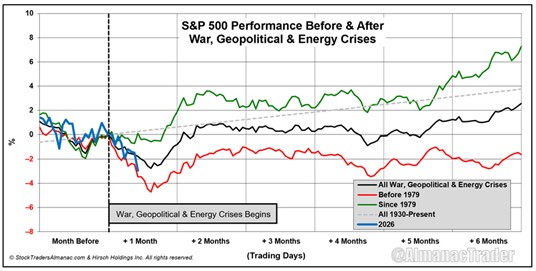
In this chart we have plotted the S&P 500’s average performance before and after the start of several crises. Each month in the chart uses 21 trading days as this is the average number of trading days in a month. The gray dashed line represents the average of all rolling seven-month periods beginning in 1930 and serves as the baseline.
When presented in this manner, the S&P 500 generally hit its low around 13 to 15 trading days after the crisis began. If the current crisis follows a similar path, the market’s low could occur sometime soon. By the “+1 Month” point in the chart, the most encouraging outcome would be for S&P 500 to be back above its pre-crisis close – the Feb. 27 close at 6,878.88.


