

The 10-week exponential moving average (EMA) for the S&P 500 Index (^SPX) is starting to decline below the 21-week EMA, and any follow-through could turn into a major intermediate-term warning. The last bearish crossover was in March 2025 and, prior to that, just as the last bear market was getting started in February 2022, notes John Eade, president of Argus Research.
We did see a bearish crossover in October 2023 near the bottom of that pullback, but that signal was reversed quickly.
S&P 500 Index (^SPX)
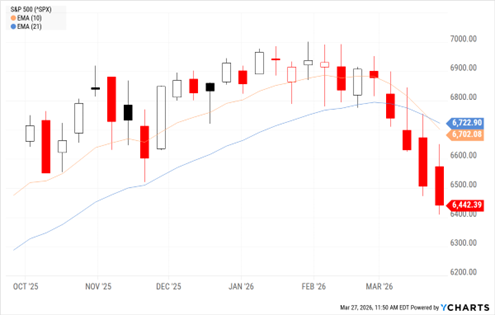
Data by YCharts
The SPX has also fallen below its 13-, 26-, and 40-week EMAs for the first time since March 2025 and the 13-week is close to a bearish cross of the 26-week EMA. The two shorter averages have rolled over and are heading lower, while the longer average has flattened. A sell signal would occur if the 13-week falls below both the 26- and 40-week EMAs and the 26-week declines below the 40-week EMA.
The SPX is sitting right at range lows from November 2025, and we consider this the last piece of chart support. The only other key support is the 50-week average at 6,450. If that doesn’t hold, we could see a flush to 6,100. We say “flush” as there is little chart support under current prices until we reach the last chart platform from 2025.
Longer-term breadth has declined to critical levels, with the percentage of SPX stocks above their 200-day down to 48%; down to 51% for the S&P 100; and down to 45% for the Nasdaq 100. Shorter breadth measures are washed out, with the percentage of SPX issues above their 50-day down at 25% and the percentage of issues above their 20-day down at 19%. Recent market bottoms have occurred when both these percentages drop to 20% or lower.


