

The equity market has made a miraculous recovery from recent lows. Not surprisingly, the rebound in risk assets has allowed correlated assets, such as metals like copper, to track higher, observes Carley Garner, senior commodity market strategist and broker at DeCarley Trading.
In fact, the stock market has traveled what is historically a year or more worth of gains in just 10 sessions, putting it in the 99.7th percentile of rallies. We’ve been tabbing the correlation board for clues and have discovered that copper, gold, and silver have all been trading with a moderate positive correlation to the dollar and a healthy positive correlation to the S&P 500 Index (^SPX).
(Editor’s Note: Carley will be speaking at the 2026 MoneyShow Masters Symposium Las Vegas, scheduled for July 20-22. Click HERE to register.)
Copper Futures (Weekly Chart)
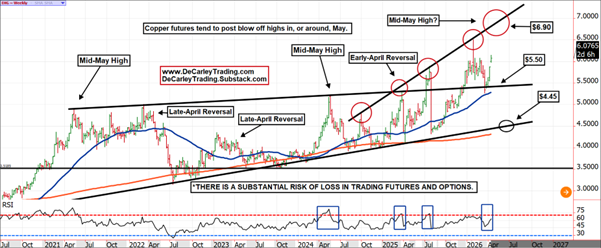
We believe this opens the door to a continuation of the metals rally in the short run, but it will likely set up much larger setbacks. For instance, the copper futures market tends to either roll over in late April or experience a blow-off top that fails in May. Of course, historical patterns don’t guarantee to play out in the future, but they are likely to.
The weekly chart shows a sharply rising trendline that began forming in late 2024. Each subsequent rally has extended to new highs but met selling pressure at this trendline. With this and seasonality in mind, we suspect the copper market is setting up for a run to just under $7.
However, we wouldn’t expect a breakout or even the rally to sustain itself. Instead, historical patterns suggest that market participants would reject the rally, triggering a large setback that could see prices fall as low as $4.50-ish.
If you are a copper bull, plays should consider the lopsided risk-to-reward ratio ($1.50 in risk versus $0.80 to $0.90 in profit potential). If you are a bear, look for opportunities near the trendline ($6.90-ish).


