

Just when you thought it couldn’t get any worse, it did. Consumer confidence sank even further than the depressed levels I highlighted in April – hitting its lowest since the University of Michigan started collecting data in 1952. While higher oil prices and inflation worries are part of it, there’s a deeper, underlying force at work.
Check out my MoneyShow Chart of the Day. Courtesy of the Wall Street Journal, it shows the share of gross domestic income that employees are capturing. At 51% in Q1, it was the lowest since the government began tracking in 1947. On the flip side, corporate profits accounted for 12.1% — the most since 1950.
Why is “Main Street” So Glum? Maybe It’s This...
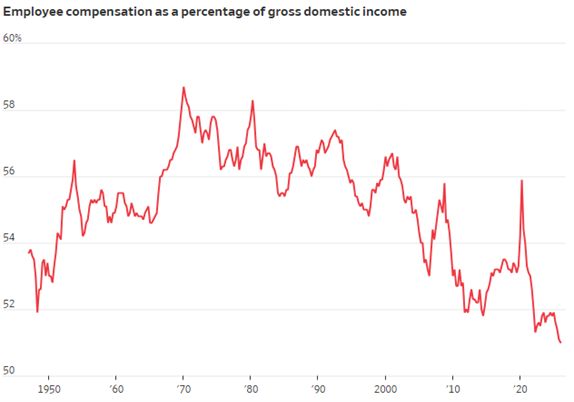
Source: Wall Street Journal
Stated another way, companies are “feasting.” Since the stock market is ultimately driven by earnings, it’s trading at record highs. Wall Street is happy.
But consumers are “starving,” with workers essentially capturing a smaller percentage of the economic pie. Since personal financial health strongly influences sentiment, consumer confidence readings are sliding. Main Street is unhappy.
Yes, the data has some statistical quirks, as the Journal notes. Gross Domestic Product (GDP) and Gross Domestic Income (GDI) are calculated differently, and the way GDI accounts for depreciation could overstate the slump in labor’s share of income.
But if you’re trying to get to the bottom of the “How can people be so glum when the stock market is so strong” mystery, this chart is a start. As an investor, it helps to know WHY things are the way they are – even if sentiment data isn’t a consistent stock market driver they way earnings are.


