

The S&P 500 Index (^SPX) has continued to make new highs, but the story beneath the surface is far different. Technology and semiconductors have become the dominant force behind market performance, creating a widening gap between the S&P 500 and nearly every other major sector and factor, writes Lance Roberts, editor of the Bull Bear Report.
Many diversified portfolios may appear to be lagging despite owning fundamentally strong companies. Meanwhile, an overbought tape like this one can pull back hard and fast – and an RSI north of 73 says we’re stretched. But stretched is not broken. The bottom line is that the math of this rally argues for a pause, not a peak.
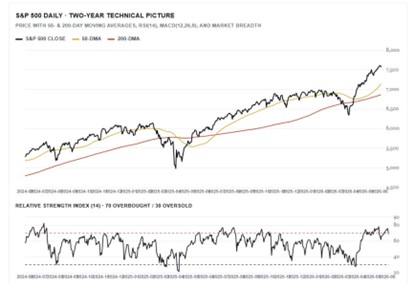
After nine straight weeks of gains and a record 7,609.78 close on Tuesday, the S&P 500 gave a little back on Wednesday and finished at 7,554, down about 0.7%. One soft session proves nothing. The trend is up, and it isn’t close.
The index sits roughly 6% above a rising 50-day moving average and about 10% above the 200-day, with the 50-day a healthy 4% above the 200-day. Nothing in the primary trend says “Sell.” The caution appears beneath the price, in the gauges that show how the move is being made.
So what do you do with this? Don’t fight the trend. Staying invested has been the right call all year, and one down day doesn’t change the bigger picture.
But this is NOT the spot to be adding aggressively. With breadth this narrow and momentum rolling at the highs, the reward for putting fresh money to work up here is poor. We continue to suggest using strength to rebalance back to target weights, trim your most extended winners, raise a little cash, and keep your stops honest.


