

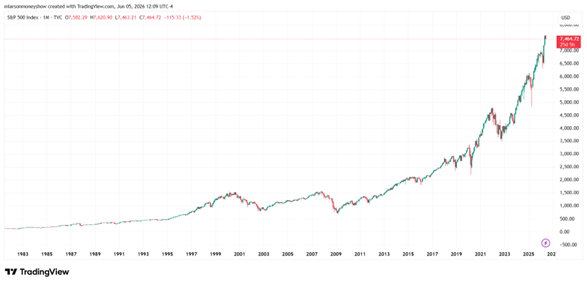
We widen our lens today, looking at the big-picture monthly chart of the S&P 500 Index (^SPX) going back to 1980, a shift from the mundane minutiae of day-to-day activity. Weekly momentum is overbought but, bullishly, we do not have any momentum divergences, observes John Eade, president of Argus Research.
The monthly chart shows two secular bull markets (1982 to 2000 and 2009 to the current day) as well as two market crashes (2000 to 2003 and 2007 to 2009).
The price structure of the current bull market versus the 1982 bull run is somewhat similar. The first bull was 18 years long, and the current is 17 years old and counting. The SPX rose 1,391% in the first and, at the recent high, the current advance is 880%.
S&P 500 Index (^SPX)
Source: TradingView
If the current run rises as much as the 1982 secular advance, that will target 11,574 for the index. Unfortunately, a stock market prediction is never that easy. We saw a steep price slope that took place at the end of the first bull, from 1995 to 2000.
The slope of the current advance has steepened twice since 2020, but it is not as steep as the Dot-Com Bubble...yet. There is a good chance it will steepen further into the AI boom.
Examining the monthly Coppock Curve (a long-term momentum indicator), we see that a few of the major bearish divergences in 1999 and 2007 led to mega market meltdowns, while the one in 1987 led to the crash. But other bearish divergences led only to pullbacks and corrections.
The SPX traced out a major divergence in early 2025, although that occurred after a momentum reset during 2022's bear market. So, it might not be as critical as past divergences. So far, we do not have any momentum divergences like those that we saw in late 2024/early 2025 and in late 2021.


