

First, 10-year Treasury yields hit the highest level since 2023. Then they hit the highest since 2007. Now, they’re hitting the highest since 2002! Is it time to play contrarian yet?
Take a look at my MoneyShow Chart of the Day. It’s a monthly chart of the 10-year yield going back more than a quarter century. You can see that the move higher is showing no sign of letting up. And if the 10-year tacks on another 25 basis points or so, it’ll hit the highest since the century began in 2000!
Long-Term Treasury Yields Just Hit a 24-Year High!
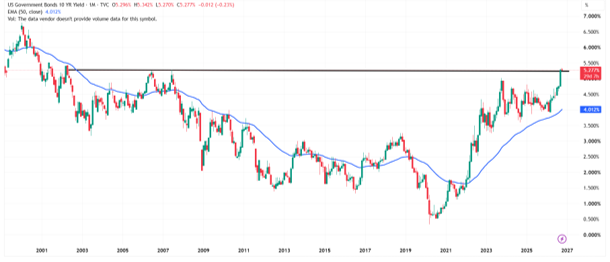
Source: TradingView
You know the forces at work by now because I keep writing and talking about them. Higher oil prices. Rising inflation worries. Massive borrowing by hyperscalers. Washington’s utter lack of fiscal discipline. Solid economic growth. The list goes on and on.
Some traders are trying to pick tops (in bond yield) and bottoms (in bond price). Some investors are buying bond ETFs because of higher yields. But from a technical perspective, I still haven’t seen a washout-and-reversal move in things like long bond futures or the iShares 20+ Year Treasury Bond ETF (TLT).
Those would be signs to play contrarian, at least for a little while. For now, keeping your head down is a solid trading strategy in fixed income markets.