Traders looking to get involved in the energy markets have an important decision to make about what to trade. Energy analyst Cynthia Kase discusses the pros and cons of energy futures and ETFs.
Traders these days are interested in trading energy, but what’s the best way to do that? Is it through the futures market or through ETFs?
Our guest today is Cynthia Kase to talk about that issue. So, Ms. Kase, talk about some of the differences between trading energy futures and ETFs.
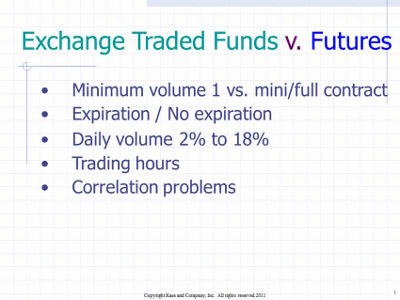
Well there are some advantages and disadvantages to trading futures versus ETFs. ETFs—and I’m focusing on the United States Oil Fund (USO) and United States Natural Gas Fund (UNG) in this conversation—trade in one-unit increments.
So, one unit might be equivalent to roughly one unit in the futures market. Sometimes it might be two or three units; sometimes it might be a third of a unit, but if you consider one unit in crude as one barrel, or one unit in gas is one MMBtu, there is roughly a third to three times an equivalent.
So, a small trader can trade the equivalent of, let’s say, three barrels of crude, or 300 MMBtu’s of natural gas, or 3000 MMBtu’s of natural, gas as opposed to a full contract of 10,000 MMBtu’s of gas or 1000 barrels.
Even in the minis, the crude oil mini is half the size of a regular futures contract (500 barrels), as opposed to two or three barrels, and 2500 MMBtu’s, which is a quarter, as opposed to maybe the equivalent of 300 or so MMBtu’s.
So even with the mini contract, you’re talking about some margin issues. You’re going to have to put up more money for that.
With the mini contract, you’re still going to have many, many, many times the equivalent of one ETF unit.
All right, let’s talk about some of the differences then in the ETFs versus futures.
Okay, well, the futures contract expires every month. The January contract expires towards the end of December, for example. With the ETFs, they never expire, so for an investor who wants to invest long term in energy, it might be a good choice. There are some challenges, though, for traders.
For one thing, the volume is much smaller: about 18% when I took a snapshot on crude and 2% on natural gas volume equivalents.
Also, the ETFs trade only during the New York Stock Exchange hours, and so the result of that is you can get aberration and gaps in the data. Also, there are some correlation issues.
I’d like to show in this conversation just some of the challenges that we face with the trading hour and small-volume issues.
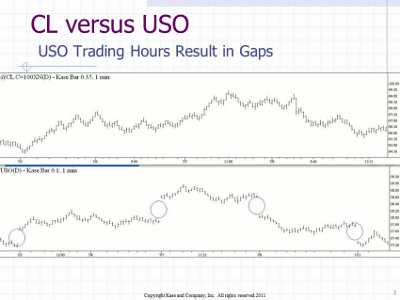
|pagebreak|Here, we have a crude oil versus USO chart, and the chart with no circles on it is the crude oil chart. You can see that there are no big gaps on the crude oil chart, whereas on the USO chart, there are a number of gaps that result from differences in the trading hours, the fact that they are not trading while the futures contract is trading.
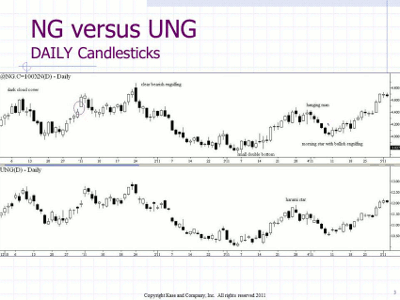
Even more so, we can see by looking at natural gas versus UNG. The chart on the top of natural gas shows a normal breakaway gap, a clear bearish engulfing line at the second peak in the market, a small but discernible double bottom at the bottom on the next trough, a hanging man, and then a morning star with a bullish engulfing line. On the entire UNG chart, the bars are so aberrant that we only have one candlestick pattern, and that’s just a hanging man.
So, it sounds like in different situations, you just have to be aware of which one is the best for your trading size, for your risk tolerance, all of those things together.
Yes, and be aware that the differences on a day-to-day basis in terms of the patterns may be significant.
Related Reading:


