Selling in some of the high yield bond fund ETFs has been heavy, so MoneyShow's Tom Aspray takes a look at the weekly and daily technical studies to see if the bond market is turning and what to expect next depending on the outcome of next week's FOMC announcement.
The stock market rebounded nicely Wednesday but concerns over next week's FOMC meeting may cut short the rebound. The major averages had tested short-term support before turning higher. The market internals were slightly positive as the McClellan oscillator has turned up to -79. A close back above the zero line would be a short-term positive.
The futures are lower in early trading and the selling in the Eurozone markets has increased since they opened. The focus has turned to the bond market as the yield on the 10-Year T-Note has risen from 2.32% at the end of August to 2.53% Wednesday.
Last week's fund flow data showed that money moved out of high yield funds for the first time in four weeks. I would expect this week's data to show even more dramatic outflows as the selling in some of the high yield ETFs has been heavy.
Is the bond market in the process of turning? A look at the weekly and daily technical studies will help you be prepared for the remaining months of the year.
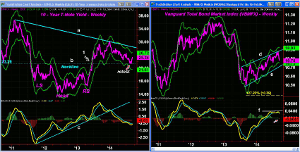
Chart Analysis: The weekly chart of the 10-Year T-Note Yields shows that the recent drop in yields just took them back to important support.
- A major reverse head and shoulders bottom formation was completed in May, point 1, as the neckline (line b) was overcome.
- Yields then surged to above the 3.00% level forming the second point for the weekly downtrend, line a.
- The weekly starc+ band is now at 2.672%.
- The quarterly projected pivot resistance is at 2.749% while the downtrend is at 2.853%.
- In classic chart terms, the recent retest of the neckline is quite normal.
- The weekly MACD-His turned negative last fall and the uptrend, line c, was broken in early 2014.
- The MACD analysis shows signs of bottoming but no new buy signals have been triggered yet.
- The daily MACD analysis did turn positive last week.
- There is now short-term support in the 2.439% area.
The Vanguard Total Bond Market Index (VBMFX) was discussed in early August as it is one of the largest bond funds with total assets of $121 billion. It has a current yield of 1.94%.
- It is up 3.86% YTD and the weekly chart shows a classic flag formation, lines d and e.
- This is consistent with a rebound that is normal after a sharp decline.
- A weekly close under $10.71 will complete the formation.
- The 127.2% Fibonacci target from the formation is at $10.39%.
- This would be a decline of 3.6% from current levels, almost double the current yield.
- The MACD line formed lower highs last month and this negative divergence, line f, is consistent with formation of a top.
- There is resistance now in the $10.82-$10.85 area.
- The daily starc- band is now being tested, which increases the odds of some stabilization or a rebound over the short-term.
NEXT PAGE: Two More Bond ETFs to Watch
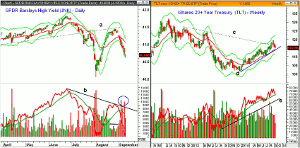
|pagebreak|The SPDR Barclays High Yield ETF (JNK) has assets of $9.17 billion with a current yield of 5.76%.
- JNK is up 3.70% YTD but down 1.22% in the past three months.
- At the early August low of $40.06, the weekly uptrend was tested.
- The rally from these lows just tested former support now resistance (line a) in the $41.50 area.
- JNK has been testing its daily starc- band for the past five days as the quarterly projected pivot support at $40.35 has been reached.
- There is resistance now at $41.04 and the declining 20-day EMA.
- The volume was very heavy at the August lows but quite light as JNK peaked at the end of the month.
- The selling has been heavy over the past week.
- Both the weekly and daily OBV are now below their WMAs.
The iShares 20+ Year Treasury (TLT) has assets of $4.61 billion with current yield of 2.91%.
- It has gained an impressive 15.15% YTD compared to 9.33% for the Spyder Trust (SPY).
- TLT is down 3.7% from its August high of $119.43.
- The resistance at line c, was just slightly overcome on the rally.
- The monthly projected pivot support at $114.92 is now being tested.
- The weekly uptrend (line d) and the 20-week EMA are now in the $113.76 area.
- A weekly close below the June low of $110.34 would complete the top.
- The weekly on-balance volume (OBV) did make a new high in August and is now testing its rising WMA.
- There is more important support at the uptrend, line e.
- The monthly pivot and strong resistance is now at $117.18.
What it Means: The short-term oversold status of the bond market does favor a rebound in the near term. If the SPDR Barclays High Yield ETF (JNK) does rally back to its 20-day EMA ahead of the FOMC announcement, it will set up an interesting situation.
If there is no significant change in the FOMC policy, it will be interesting to see if the bonds can rally substantially. The market is likely to react negatively to any signs that they are now ready to raise rates earlier than the market expects.
The daily technical studies on the ProShares UltraShort 20+ Year Treasury (TBT) are positive but the weekly analysis has not yet confirmed that a bottom is in place. Having taken two small losses in TBT this year, I will wait for weekly confirmation before buying again.
How to Profit: No new recommendation.


