In MoneyShow’s Tom Aspray's experience, basing decisions on what the market will pay for a stock is more likely to keep a trader or investor in the right stocks at the right time, so Tom takes a technical look at this online streaming media service to see if there was advance warning of the recent price surge.
The much dreaded earnings season is getting off to a better start than most were expecting. Of course, there have been some stocks that have disappointed as the Bank of America (BAC) missed on revenues and the stock dropped over 1%.
The rally Wednesday was broadly based as the NYSE Composite broke out above last July’s highs. So far, this has gotten little attention from the financial press. As I commented yesterday, this is consistent with the number of new highs in the NYSE A/D line and the S&P 500 is likely to follow suit in the near future.
A full fledged breakout will further validate the value of technical over fundamental analysis. One apparent star in this earnings season is Netflix, Inc. (NFLX) as they reported a sharp increase in international subscribers after the close yesterday.
The stock jumped 13% in after hours trading even though earnings were cut in half because of the stronger dollar. It is too early to tell if NFLX will be able to hold its gains in Thursday’s trading but it did in January.
One well known analyst from Wedbush Securities has been warning about their poor cash flow since last summer as they had a price target of $215. To his credit, the initial warning came just a few weeks before the summer high of $489.29. The stock subsequently dropped to a low of $315.54 at the end of 2014.
His long-term concerns did not change after the stock surged on earnings last January. In late trading Wednesday, NFLX was trading at $537.50, and before this surge, the stock was already up over 39% YTD.
Given the volatility of NFLX stock, it is always possible that his target will be met in the future, but technical analysts will argue that fundamentals almost always lag the price action. As I pointed out in Monday’s Wall Street's Most Hated Stocks with the Best Charts, several studies have shown that stocks least liked by Wall Street’s fundamental analysts do better than those stocks they like.
In my experience, basing investing or trading decisions on what the market will pay for a stock is much more likely to keep you in the right stocks at the right time. Besides, since stops should always be used, the market will tell you when you are wrong. Let’s look at the charts to see if there was advance warning of the recent price surge.
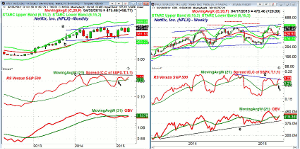
Chart Analysis: The monthly chart of Netflix, Inc. (NFLX) shows that it formed a doji in December.
- The strong close in January triggered a HCD buy signal and returned the focus on the upside.
- The monthly trading range is $174 wide so a confirmed breakout of the trading range has targets in the $660-$680 area.
- The monthly relative performance moved back above its WMA in January signaling it was a market leader.
- The monthly OBV looks less positive as it dropped below its WMA last October.
- The OBV has stayed below its WMA which is now declining.
- There is monthly support at $410 which was the March low.
The weekly chart of Netflix, Inc. (NFLX) shows that it had a weekly close above the quarterly pivot on January 23.
- NFLX tested the weekly starc+ band in February before it corrected back to its 20-week EMA in late March and early April.
- The 2nd quarter pivot at $406.88 was tested before last week’s strong close.
- The weekly RS line rallied back above its WMA last week.
- It looks ready to break its downtrend, line d, this week.
- The weekly OBV made a new high in January as it was stronger than prices.
- The pattern of higher lows, line e, is bullish with the OBV moving back above its WMA last week.
- The monthly pivot is at $435.65 with the 20-week EMA at $426.93.
Next: One More Daily Chart to Watch
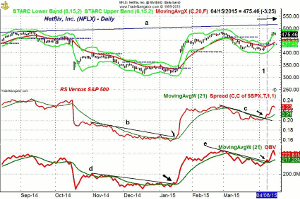
|pagebreak|The daily chart of Netflix, Inc. (NFLX) shows that it also skyrocketed on January 20 in reaction to its 4th quarter earnings as it closed up 17%.
- For five days after the earnings NFLX traded above its starc+ band before it finally consolidated.
- The daily technical studies confirm the price action in January as they turned positive the week before earnings (see arrows).
- The daily chart gave similar signals last week as the daily RS line moved above its downtrend, line c, on April 8 (line 1).
- The daily OBV also overcame its resistance at line e, two days before the up gap opening on Monday, April 13.
- NFLX is traded above its WMA in Wednesday’s session.
- It now has very minor support at $469.40 with the 20-day EMA at $443.60.
- The monthly pivot is at $435.65, which makes the risk on any new long positions very high.
What it Means: The monthly analysis does not yet support a breakout from a fourteen month trading range but this could change in the next month, or so, if the volume increases. The weekly studies were positive prior to the latest surge as they did suggest the recent pullback was a buying opportunity.
The daily technical studies should have given traders advance warning of the recent move and would have justified buying ahead of earnings.
For those of you who are still undecided about whether you should be using fundamental or technical analysis, I hope this look at Netflix, Inc. (NFLX) may help you decide.
My goal has always been to teach technical analysis, which I think anyone can learn if they are willing to do the work. It is based on the hard market data while fundamental analysis depends on analyzing a company’s data, which is always subject to revision, unlike the price history.
How to Profit: No new recommendation.


