There were signs that oil prices could be bottoming at the start of the quarter, so MoneyShow’s Tom Aspray examines the charts for crude oil, the energy stocks, and one ETF to determine if they reveal any new opportunities.
The markets held up well after the FOMC announcement, which was sort of a non-event as it gives the Fed plenty of room on rates. The very weak GDP report added to the evidence of a weakening economy, but longer-term, the Fed is positive on the economy.
The Euro markets have been hit hard recently as the Dax Index is already down 7.6% from the recent highs. So far, the pullback in the US markets has been quite orderly as the NYSE Composite, Spyder Trust (SPY) and Powershares QQQ Trust (QQQ) have held above initial support at their still rising 20-day EMAs. The small-cap iShares Russell 2000 (IWM) is acting weaker.
Asian stocks were hit hard overnight and the US futures are a bit lower. Stocks need to close the week strong to indicate that the correction is over.
The energy sector was the standout performer with the SPDR Oil & Gas Exploration (XOP) up 2.83%. While some of the social media stocks have been hit hard on their earnings, the energy companies have done much better. It was my view in February’s Are Buffett and Barron's Too Bearish on Big Oil? that bearish sentiment was too high and that the analysts’ estimates of oil companies’ earnings were too low.
At the start of the quarter there were signs that oil prices could be bottoming and an updated technical view on crude oil, the energy stocks, and one ETF reveals some new opportunities.
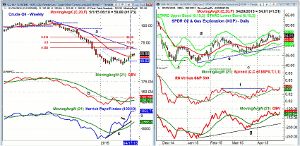
Chart Analysis: The weekly chart shows the steady climb from the late March lows when the continuous crude oil contract made a low of $42.85.
- Prices closed above the 20-week EMA over two weeks ago after a weekly close above the quarterly pivot on April 10.
- The weekly downtrend and the 38.2% Fibonacci resistance are in the $67.50 area.
- The 50% retracement level is at $75.19.
- The weekly OBV completed its bottom formation on April 17 as it moved through resistance at line b.
- The Herrick Payoff Index (HPI) formed a bullish divergence at the lows, line c.
- This was confirmed by the move above the intervening peak (see arrow).
- The move above the zero line signaled positive money flow for the first time since August 2014.
- Initial support now at $56 with the quarterly pivot at $48.53.
The SPDR Oil & Gas Exploration (XOP) broke through resistance at line d, on April 15.
- The recent pullback has taken XOP back to the 20-day EMA before Wednesday’s strong close.
- The daily starc+ band is at $56.28 with the monthly pivot resistance for May at $60.14.
- The relative performance confirmed the price action by moving through its resistance at line f.
- It has moved back above its WMA signaling that the correction is over.
- The OBV shows a strong uptrend, line g, and held its WMA on the correction.
- The 20-day EMA is at $52.86 and further in the $52.50-$52 area.
- More important support in the $50 area.
Next Page: Another Energy Stock to Watch
|pagebreak|Noble Corporation (NE) is a $3.84 billion oil and gas exploration company that reported strong earnings Wednesday as revenues grew nicely as drilling margins improved.
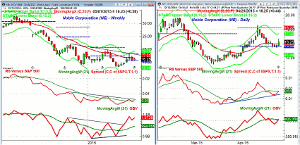
- NE hit the weekly downtrend, line a, and exceeded the quarterly pivot resistance at $18.22 in the middle of April.
- The weekly starc+ band is at $19.29 with the February high at $19.62.
- The weekly RS line is moving back above its WMA.
- A strong move above resistance at line b will confirm that it has bottomed.
- The weekly OBV formed a bullish divergence, line d, at the recent lows.
- This divergence was confirmed by the move through resistance at line c.
- The OBV is clearly acting stronger than prices.
The daily chart of Noble Corporation (NE) shows the correction from the doji high (see arrow) on April 16.
- The decline seems to have been completed with the drop back to the 20-day EMA and the strong close on Wednesday.
- The quarterly pivot at $15.68 was tested on the correction.
- The daily starc+ band is at $17.42 with the recent high at $18.58.
- The daily RS line dropped below its WMA on the recent correction and has now turned higher.
- The OBV has also turned up, sharply consistent with the end of the correction.
- The low on Tuesday was $15.25 with additional support in the $14.89-$15 area.
- The daily starc+ band is at $14.44.
What it Means: It does appear that crude oil has turned the corner in the 2nd quarter, but many analysts are still quite negative. This allows for a rally as high as the $65-$67 area. The SPDR Oil & Gas Exploration (XOP) looks better technically than the Sector Select Energy (XLE).
The weekly bullish divergences in many of the oil stocks suggest that an important low is in place. Traders could look to buy XOP or NE for a rally above the previous highs but would use trailing stops.
How to Profit: For SPDR Oil & Gas Exploration (XOP) go 50% long at $54.59 and 50% at $53.18 with a stop at $51.13 (risk of approx. 5.1%). On a move above $56.18 raise the stop to $52.25.
For Noble Corporation (NE) go 50% long at $16.25 or better and 50% at $15.78 with a stop at $15.09 (risk of approx. 5.7%). On a move above $18.16 raise the stop to $15.33.


