Is the weak monthly jobs report for March a reflection of winter weather or a sign the market is deteriorating? Does it matter? MoneyShow's Tom Aspray outlines why one should only invest or trade a seasonal trend when the technical studies are in agreement.
In what has been a volatile 2015, investors are looking forward to the long weekend and hoping that the 2nd quarter will be less volatile. Unfortunately, though it is possible, it does not seem likely given the ever-growing wall of worry that is confronting investors.
Investors will now have a few days to ponder the impact of Friday’s weak monthly jobs report for March. Instead of 247,000 new jobs that most economists were expecting, there were only 126,000 new jobs added.
The sharply lower number triggered a 20 point drop in the stock index futures in Friday’s abbreviated trading. Much of the focus this week is likely to be on debate as to whether this report just reflects the impact of the winter weather or is a sign that the economy is deteriorating.
Does it really matter? Investors should never pay too much attention to any one data point or any one bullish or bearish market forecast. As we are entering the 2nd quarter, investors will once again be hit with a flood of articles about the old Wall Street mantra, Sell in May and Go Away.
This, of course, is based on the historical data that shows weaker relative stock performance from May through October than from November to April. I have written many times in the past about seasonal tendencies and I have always stressed that one should only invest or trade a seasonal trend when the technical studies are in agreement.
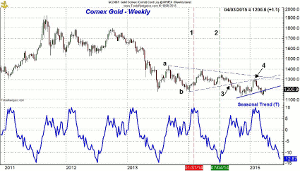
For example, gold has a well established seasonal pattern, based on data going back to 1978, of bottoming around July 4 (line 1) and topping on January 31, line 2. Of course, there are have been many years where this has not worked .On July 4, 2014, gold closed at $1320 and by January 2015 had declined to $1279 for a loss of 3.1%.
Technically, gold was weak for most of 2014 as the completion of the bear flag formation (line a and b) in September, point 3, projected another push to the downside. The rebound in early 2015 just took gold back to the bear flag resistance at point 4, so the rally was expected to fail.
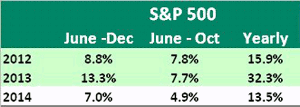
The increased attention on Sell in May over the past three years has coincided with a less-than-stellar performance of the strategy. As the table indicates, the S&P 500 was up 7.8% from June to October 2012, but only added 1% more if you look at the June to December period. It should also be noted that the market completed an important low in early June of 2012.
In 2013, there is a larger difference in the performance between June to October and June to December. This is a result of the over 5% gain in the last two months of 2013. More importantly, those that tried to side step the June to October period in 2013 might have missed out on the stock markets stellar yearly performance in 2013.
In 2014, the 7% gain from June to December would have shriveled if you gave up the 4.9% gain that occurred from June to October. It would have pushed the yearly gains into single digit territory.
With the stock market still locked in a broad trading range, investors should base any decisions on modifying their portfolio only on their individual assessment of their risk tolerance. If you panicked out of stocks late in the last bear market or deviated from your investment plan during the sever correction in 2011, then you should allocate less to stocks. Lower it to a level where a 10-15% stock market decline will not make you panic and don’t base your decision on any seasonal tendency.
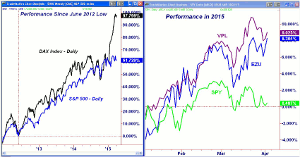
The recent short-term weakness in the US stock market must be viewed in its global context. I have frequently used this chart comparing the German Dax to the S&P 500 since the low in June 2012. During this period, the German Dax Index has been leading the S&P 500 higher. Up through last Thursday, the Dax had done 36% better than the S&P 500, which is almost 1% a month.
The divergence between the averages is so wide that a reversion to the mean or a narrowing of the gap seems likely. This, of course, could be caused by a sharp correction in the Dax or a further strengthening in the S&P 500.
The disparity, so far, in 2015 is also quite pronounced as the Vanguard FTSE Pacific ETF (VPL) is up over 9% not that far ahead of the iShares MSCI EMU (EZU) which is up 8.5%. These gains are in sharp contrast to the current 0.48% gain in the Spyder Trust (SPY).
The performance of these markets has been helped by the weakness in the yen and euro that was discussed in last September’s Profiting from a Weak Euro. Last summer, I was expecting the EuroZone economies and stock markets to get better in 2015.
Last week’s report from Markit reported that the EuroZone Manufacturing PMI came in at 52.2, which was a ten-month high. The improving growth was evident in Germany, Italy, and the Netherlands.
NEXT PAGE: What to Watch
|pagebreak|The improvement in the EuroZone economies is in contrast to the generally weakening in some of the US economic statistics. For the past few months, a weaker than expected report has been followed by one that is stronger than expected.
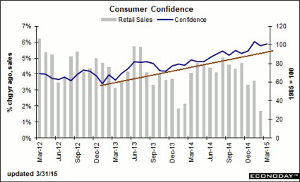
Last week’s Consumer Confidence rose sharply to 101.3, up from a revised 98.8 in February. On the chart, the rising confidence is in contrast to the downward trend in Retail Sales.
The continued softness in much of the manufacturing data suggests that the economy needs a shot in the arm from the consumer. Much of the data last week was weak, though factory orders did increase for the first time in six months.
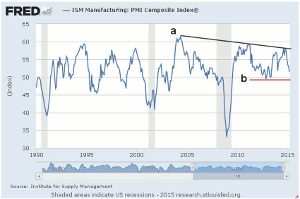
The ISM Manufacturing PMI Composite Index is one report that I am watching closely as it peaked in October at 57.9, reaching the long-term downtrend, line a, before turning lower. Last week it came in at 51.5, which is the lowest reading since January 2014. A decisive drop below the recent lows, line b, would be a reason for concern.
The economic data and strong dollar have put pressure on earnings estimates as the season starts on Tuesday, April 8 with Alcoa, Inc. (AA). It is one of the weak material stocks I discussed in 3 Material Stocks to Avoid.
The ISM Non-Manufacturing Index has been acting stronger than its manufacturing measure with the latest data out on Monday along with the PMI Services Index. Then on Wednesday, we get the FOMC minutes from their March meeting.
After the weak jobs report, Thursday’s jobless claims may get more interest with the Import and Export Prices out on Friday.
What to Watch
Just two weeks ago, the stock market looked poised to breakout to the upside, but the rally failure took most of the major averages back to the early March lows. If Friday’s selling in the futures carries over to Monday’s trading, then these lows could be violated. If so, this would set the stage for an eventual test of the support from earlier in the year.
The higher close by most of the averages last week did improve the weekly technical studies and they do not yet show formations consistent a more significant market correction.
While the iShares Russell 2000 (IWM) looks the best technically, the iShares Transportation ETF (IYT) is very close to breaking support as it has continued to lag the overall market. The airline, trucking, and marine transportation stocks have all helped push the Transports lower.
The volume analysis is still split as while the daily OBV on the IWM looks quite strong, it looks weak on the Spyder Trust (SPY). If we are going to see a deeper correction, there are consumer discretionary and social media stocks that look to be favorable risk buys on a drop back to good support.
The CNN's Fear and Greed Index is still in fear territory at 39, up from 35 last week. At the lows last August, it was in single digits. The bullish %, according to AAII, declined slightly last week to 35.40% as it was 38.43% the prior week. Just three weeks ago it reached 27.16%, which was the lowest reading in some time.
As of last Thursday, 54% of the S&P 500 stocks were above their 50-day WMA, which is just below the mean of 63%. This value needs to drop down to 30-35% to reach oversold territory.
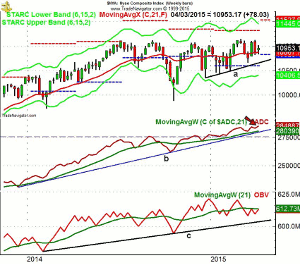
The NYSE Composite has held above the 10,780 level for the past three weeks with the uptrend, line a, now just below 10,700. The close last Thursday at 10.953 was well above the quarterly pivot at 10,828. There is more important support now in the 10,442-10,500 area.
There is near term resistance at 11,115 and a close above this level would suggest a test of the weekly starc+ bands at 11.445, if not the quarterly pivot resistance at 11,527.
The weekly NYSE Advance/Decline made a new high again last week which continues to signal a positive intermediate-term trend. It certainly does not show a formation consistent with an imminent correction of any significance. The S&P 1500 A/D line also is in a clear uptrend as it made a new high in the middle of March.
The weekly OBV turned higher last week but is still slightly below its WMA and well below the high made in February.
NEXT PAGE: Stocks
|pagebreak|S&P 500
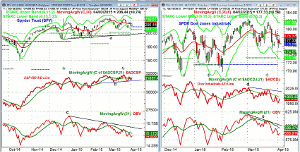
The Spyder Trust (SPY) was just a bit higher for the week as it has traded in a fairly narrow range over the past eight weeks. The support is at $203.22-$203.49 with resistance at $211.02-$211.30. The 2nd quarter pivot at $204.90 is just below the close with the daily starc- band at $203.37. The support from the broader trading range, line a, is in the 200 area.
There is minor resistance now at $208.61 with the daily starc+ band at $210.87.
The daily S&P 500 A/D line moved slightly above its WMA with last Thursday’s positive A/D numbers. It did make a new high on March 20 with support now at line b. A close below this level would likely be the start of a new downtrend.
The daily on-balance volume (OBV) has continued to diverge from prices as it has made lower lows. It is well below the downtrend, line c.
Dow Industrials
The daily chart of SPDR Dow Industrials (DIA) shows the several wide swings during March as DIA closed Thursday just barely above the quarterly pivot at $176.58. A break of this level should signal a drop to monthly support at $174.57. There is more important support at $172.
The daily Dow Industrials A/D line formed lower highs in March, line d, and is now back to support from February. The A/D line needs to move above the downtrend, line d, to turn positive.
The daily OBV looks even weaker as it shows a clear pattern of lower highs, line e, and lower lows. The weekly OBV gives a much different picture as the OBV is still holding above its flat WMA.
There is resistance for DIA first at $178.37 and then in the $180 area.
Nasdaq 100
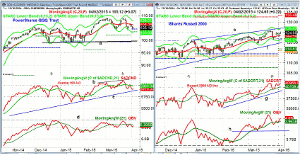
The PowerShares QQQ Trust (QQQ) was a bit lower for the week as it closed just above the 20-week EMA and the quarterly pivot at $104.63. There is monthly projected support at $103.50 with the daily starc- band at $103.03. There is major support in the $100 area, about 5% below current levels.
The daily Nasdaq 100 A/D made higher highs in March, line b, with a new high on March 20. The A/D line is now below its WMA and shows a short-term pattern of lower lows. The weekly A/D line (not shown) is still above its WMA and made a new high in March.
The daily OBV is back to support from the March lows. It tested the December highs, line d, in March but was not able to breakout to new highs.
The 20-day EMA and initial resistance is at $106.28 with the daily starc+ band at $108.01.
Russell 2000
The iShares Russell 2000 (IWM) closed not far below its all time high at $125.94. It is up 4.53% YTD with the daily starc+ band at $126.97. The quarterly pivot resistance is now at $133.48. There is short-term support at $123.40 with the daily starc- band at $121.21. The quarterly pivot is at $121.39.
The IWM held above the monthly pivot at $120.11 on the recent correction and the rising 20-week EMA is now at $119.22.
The daily Russell 2000 A/D continued to look strong as it made another new high last week. It is well above its WMA with more important support at line g.
The daily OBV made a sharply higher high on March 20 and then pulled back to its WMA last week. The OBV has initial support at early March highs with more important at line h. The weekly OBV (not shown) broke out in the middle of March and is well above its rising WMA.
NEXT PAGE: Sector Focus, Commodities, and Tom's Outlook
|pagebreak|Sector Focus
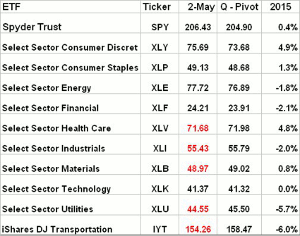
The iShares Dow Jones Transportation (IYT) has dropped 5.8% in the past two weeks and closed Thursday below the new quarterly pivot at $158.47. The quarterly projected pivot support is at $151.97 with the weekly starc- band at $152.01.
The weekly technical studies have now broken support and this suggests that IYT can go even lower.
Most of the sector ETFs are flat or lower for the year. On the table, I have highlighted the closing price in red if last Thursday’s close was below the new quarterly pivot. As I have mentioned in past articles about pivot analysis, the start of a new quarter is often a tricky period. It is sometimes better to wait for two consecutive weekly closes below the pivot before a trend change is confirmed.
The Select Sector Health Care (XLV) has dropped 3.8% in the past two weeks and is now up just 4.8% for the year. It also closed a bit below its pivot, so this week looks to be important. The Select Sector Consumer Discretionary (XLY) is doing slightly better than XLV as it is up 4.9% for the year.
The Sector Select Technology (XLK) is now flat for the year as it closed a hair above its pivot. The battered down Sector Energy (XLE) closed above its pivot but is still down 1.8% for the year. The weekly studies have improved for XLE but are still negative.
The Select Sector Utilities (XLU) is down 5.7% for the year, while the Sector Select SPDR Financial (XLF) is down 2.1%.
The Select Sector Consumer Staples (XLP) is up 1.3% for the year.
Crude Oil
The June crude oil contract closed the week flat, but as I discussed last week in Can Crude Turn in the 2nd Quarter? there has been some improvement in both the short- and intermediate-term technical outlook.
Precious Metals
Both the SPDR Gold Trust (GLD) and the Market Vectors Gold Miners (GDX) closed the week with minor gains as the late week decline in the dollar has helped the precious metals. I will be watching any further rally closely.
The Week Ahead
The stock market is becoming more mixed as the NYSE Composite and Spyder Trust (SPY) are back in their trading ranges. If we see more selling in reaction to the jobs report, then these averages could drop back to the lower boundaries of their several month trading ranges.
The question is whether investors are more concerned by the state of the economy, or, if instead, they focus on the fact that weak data makes the Fed less likely to raise rates. Technically, the stock market’s major trend is positive with the small-cap stocks like the iShares Russell 2000 (IWM) leading the other major averages.
This is becoming more of stock pickers market as there are some charts that look pretty good and there are others that look pretty ugly. I continue to favor stocks, especially with bond yields so low, but I think you have to match your stock allocation to your own risk tolerance.
It could be a rough week, so be sure to use stops and follow them. If you are underinvested in stocks, use further weakness to start a dollar cost averaging program in both a US and global fund or possibly the Vanguard Total World Stock Index Fund (VT).
Don't forget to read Tom's latest Trading Lesson, Accurately Analyzing RSI Divergences.

