
Many of the major markets are becoming increasingly correlated, and it’s tough to get a feel for currencies or commodities without checking the bond market and stock market as well, writes Tyler Yell of DailyFX.com.
While some markets are more closely related than others, one equity market has held an amazingly tight correlation to a currency pair for a very long time.
Visually, it’s easy to see that, “as goes the Nikkei, so goes USDJPY.” If you’re comfortable with the correlation coefficient reading, since the beginning of May, USD/JPY has been positively correlated to the JPN225 or Nikkei by a matter of 0.821. If you’re not familiar with the correlation coefficient, it is a statistical number between -1 & +1 calculated to present the linear depending of two variables. 1.0 is a perfect positive correlation and -1.0 is a perfect inverse correlation. Anything above 0.5 or below -0.5 is considered a significant correlation, including of course, USD/JPY and JPN225 at 0.821.
The High Correlation of JPN225 to USD/JPY
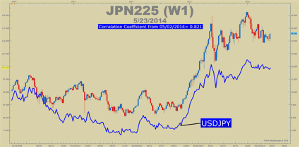
Presented by FXCM’sMarketscope Charts
Click to Enlarge
Because traders are always working to build an edge, we can look for signs of strength in one to help us see upcoming strength in the other. Let’s break down some of the developments in both markets and specifically the JPN225 to see what may be on the horizon for the JPY crosses.
Bullish Key Week on Nikkei 225 & More!
A lot of bullish developments on the JPN225 were formed on the close of the weekly candle. Let’s break them down before talking about their currency implications:
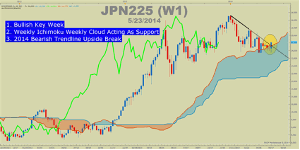
Presented by FXCM’sMarketscope Charts
Click to Enlarge
The first thing that many traders look for on a chart is a price action signal. One of my favorite signals is known as a bullish key candle where the candle pushes lower than the prior low but closes higher than the prior candle’s high. This is additionally important if the low is a new low for a significant period of time or of significant support, which you can see is true on JPN225 above.
Secondly, you’ll notice a cloud on the chart below price. This cloud is part of the dynamic Ichimoku indicator. In uptrends, Ichimoku’s cloud will often act as support, and in downtrends, Ichimoku’s cloud may act as resistance. Given the bullish key week off the weekly cloud touch, that adds significance to the move.
Lastly, you’ll see a trendline drawn from the high from the start of 2014. Price has stayed below this trendline on a closing basis until last week’s close. Trendline breaks are simple ways to see that if nothing else, a trend is losing momentum and could soon be reversing.
Now that we’ve seen three components that argue for further upside in the JPN225, let’s see how this could apply to forex given the high correlation earlier discussed.
USD/JPY Implications
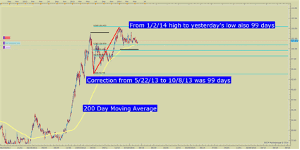
Presented by FXCM’sMarketscope Charts
Click to Enlarge
The USD/JPY has yet to move as explosively higher in the same way as JPN225. However, upon close look, you’ll see there are budding developments on USD/JPY that could bring opportunity to buyers. Let’s have a closer look on a tighter time frame.
A Closer Look at USD/JPY
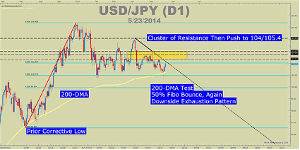
Presented by FXCM’sMarketscope Charts
Click to Enlarge
USD/JPY is not without its positive signs. We’ve had a bounce similar to the Oct. ’13 low, which resulted in a 900+ pip push higher. Last week, the Bank of Japan Governor, Kuroda mentioned that he didn’t see JPY strengthening against the USD (read: doesn’t seeing going lower) and he commented on the “very strong” economic recovery in the US vs. the one in Japan.
However, with the evidence in favor of upside, let’s take a look at the chart resistance ahead. There is a cluster of resistance point between the May 13 high of 102.36 & the May 2 high of 103.02. If we can have a weekly close through these levels, then a retest of the prior highs could very well be under way. If price stays below these levels, it would appear that the correction still needs to complete before moving higher.
By Tyler Yell, Trading Instructor, DailyFX.com


