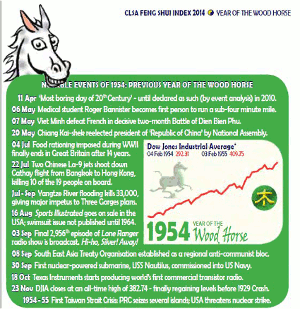
For those who follow Chinese astrology, 2014 is the year of the wood horse, which is supposed to be one of wealth and success. MoneyShow’s Tom Aspray takes a technical look to see whether investors can expect it to be like a previous wood horse year, 1954, when the Dow gained almost 40%.
Last week started off with fears of Armageddon as the contagion from the emerging markets hit the developed stock markets quite hard. The S&P 500 futures lost 44 points by mid-afternoon, Monday, with little in the way of a bounce. The gloom seemed to spread over the next two days as several economists tempered their bullish economic outlooks for 2014.
The weaker-than-expected Factory Orders last Tuesday did not help much though stocks did stabilize. Investors pulled a record of $8.8 billion from stock funds and ETFs during the week ending February 5, according to Lipper, Inc. Many moved into the perceived safety of the bond market with $10.7 moving into the bond funds and ETFs.
Thursday’s gain in the Dow was the best of the year, so traders, as well as investors were understandably nervous going into the monthly jobs report last Friday. Though the stock index futures dropped initially on the report they soon reversed course to close the day sharply higher. Many investors are now more confused than ever as they don’t know whether they should be buying or selling and probably can’t decide how much to have in the stock market as we head into 2014.
Many of you may be aware that according to the lunar calendar, the New Year began on January 31 with the year of the wood horse. Each year an animal is paired with one of the elements. In 2002 it was the water horse, which was preceded by the fire horse in 1990. Other recent horse years were 1978, 1966, and 1954. The investment banking and asset management firm, CSLA, has released its tongue in cheek annual Feng Shu Index report for the New Year.
Both 1978 and 1954 were pretty good years for stocks following the lunar calendar, and in 1954, the Dow had one of its best years ever, gaining close to 40%. That kind of year in 2014 is beyond everyone’s expectations, even mine.
The technical outlook has improved as it is no longer overbought and the sentiment has also become more negative, which was needed before stocks could mount a sustainable rally. Still, there are no clear signs yet that the correction is over, but the longer-term analysis continues to indicate that this correction is a buying opportunity.
I still think that 2014 will be a year when the January barometer will be wrong, and I feel even more confident that at some point the S&P 500 will be up at least 10% for the year.
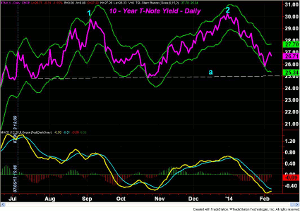
The recent drop in bond yields has gotten quite a bit of attention and those who switched into bonds last week are obviously hoping that rates will move even lower. The daily chart of the 10-year T-note yield shows what could be a double top formation as indicated by points 1 and 2. It will take a decisive drop in yields below 2.50%, line a, to confirm this interpretation.
The longer-term analysis suggests to me that this is more likely a continuation pattern or a pause in the trend towards higher yields. If so, it will eventually be resolved by a convincing move in yields above the 2013 highs. The current range could last for some time, though the daily MACD analysis could turn back to positive in the next week or so. This may mean yields will move back towards the upper boundaries of their recent range.
The European Central Bank stuck with its low rates last week and apparently plan to keep them low for some time. This will be a plus for the German and Italian bond sales next week. Late last week, a German court questioned the legality of the ECB’s bond-buying program, but so far, the markets are not worried.
There was also no change from the Bank of England as they did not want to take any chance that rising rates would stall their recovery. As reported by the Wall Street Journal “The bank's ‘forward guidance’ states that officials won't consider raising the interest rate until the unemployment rate fell to at least 7%.” Their main interest rate has been at 0.5% since March of 2009.
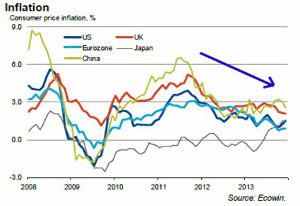
Many were disappointed that the ECB did not lower rates as the Eurozone inflation rate dropped to 0.7%, which is well below their target of 2%. The consumer inflation rates of the US, Eurozone, China, and the UK still show longer-term downtrend (see chart). Japan is the only exception as its consumer inflation moved above the zero level in 2013. These low inflation numbers and the threat of deflation are something the central bankers and investors should not ignore.
NEXT PAGE: What to Watch
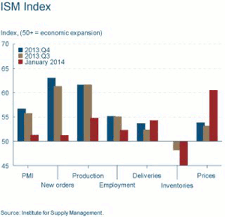
|pagebreak|The seasonal adjustments that happen every year at this time make interpreting the data even more difficult. As I warned a few weeks ago, one needs to expect a series of bad data points in any recovery. Last week, it was the Purchasing Mangers Index that hit an already weak market on Monday.
It fell 5.2% to 51.3% in January but stayed above the key level of 50, which has only been broken twice since July 2009. New orders were hit the hardest, down 13.2%, for the largest monthly decline since December 1980.
This made the ISM Non-Manufacturing report last Wednesday a pleasant surprise as it rose slightly last month despite the very poor weather in January. The economic calendar is light this week though Janet Yellen is scheduled to give her first testimony to the House Financial Services Committee on Tuesday.
The Treasury budget is out on Wednesday with Jobless Claims, Retail Sales, and Business Inventories on Thursday. The retail data will be of particular interest as the same-store chain-store sales caused some retail stocks to move sharply higher last week while others dropped on the data.
On Friday we get the Import and Export Prices, Industrial Production, and Consumer Sentiment.
What to Watch
At the end of 2013, I suggested that investors and traders should be ready for more volatility, and after last week, the markets have already done a good job of jerking the majority around.
Last week, the Spyder Trust (SPY) dropped below its quarterly pivot at $177.97 but failed to close the week below it. The SPY dropped as low as $173.71 on Tuesday but again managed to close the week back above its quarterly pivot.
I will be looking at those ETFs that have not had a weekly close below their quarterly pivots and will share the results next week. If you want to do your own research over the weekend, here is a link to the table (1st Quarter ETF Levels to Watch).
There were clearly signs of panic selling last week but it is unclear yet as to whether it was enough to complete the cycle of selling. V-shaped bottoms are rare though we have seen more in the past few years. Many stocks, like The Walt Disney Co. (DIS), which was one of the most overbought Dow stocks rallied sharply from good support as expected on strong earnings. This is the type of buy situation I will continue to look for.
The number of bullish individual investors, as I mentioned early Friday, is now down to 27.9% and could drop back to the low 20% area if we get another wave of selling.
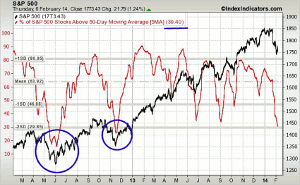
The % of S&P 500 stocks above their 50-day MAs has already reached oversold levels with the five-day MA down to 30%, which is a lower level than it reached in all of 2013. It is now two standard deviations below the mean of 63.92%. At the June 2012 lows, it dropped below 20%, but I will be watching for this to turn up, which could happen this week.
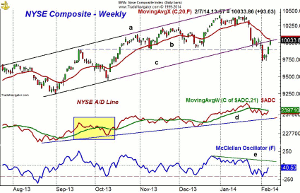
The daily chart of the NYSE Composite shows that it closed below the lower boundary of its trading channel, line c, at the end of January. The drop early last week took it well below the November and December lows (line b) as it hit 9738.
The NYSE closed below its quarterly pivot at 10,082 on Friday Janaury 24, and is still barely below it with Friday’s close. The 20-day EMA is now at 10,062 with the monthly pivot just a bit higher. There is initial support now at 9900.
NEXT PAGE: Stocks
|pagebreak|The daily NYSE Advance/Decline has turned up sharply but is still just below its WMA. To signal that the correction is over it will need to move strongly above its WMA and then start a clear new uptrend. It is a positive sign that the A/D line has held well above its long-term uptrend, line d.
I have highlighted the correction last September and October, which looks a bit similar to the current decline. It lasted 15 days from top to bottom. The current decline from the high on January 21 has lasted 14 days.
The McClellan oscillator only made it to moderately oversold levels in the -200 area on the recent decline before turning higher. A move back above the zero line would be an encouraging sign. A strong move above the resistance at line d would be a bullish sign.
S&P 500
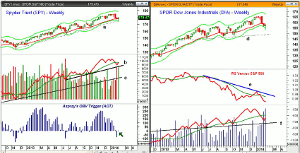
The Spyder Trust (SPY) tested its weekly starc- band and the uptrend, line a, last week before turning higher. The 38.2% Fibonacci support at $174.43 was violated on Monday’s close but prices have held above it since.
The strong rally from the lows is likely making those on the short side a bit nervous as the 20-day EMA at $179.40 was exceeded on the close. The SPY did also manage to close back above the 20-week EMA.
The monthly pivot is at $179.90 with further resistance at $181.66. The monthly projected pivot resistance is at $183.12.
The weekly on-balance volume (OBV) has turned up sharply from the prior week’s lows and is very close to moving back above its WMA. The decline has held so far above the first support at line b, with longer term support at line c.
Aspray’s OBV Trigger (AOT) is close to flipping back to positive and will do so this week on a positive close (see arrow).
The S&P 500 A/D line (not shown), which did confirm the January highs, has moved back above its WMA, which is a bullish development.
Dow Industrials
The weekly chart of the SPDR Dow Industrials (DIA) reveals that it dropped well below its weekly starc- band last week as it reached a low of $153.12. There is longer-term chart support now in the $148.60 area.
The close last week was below the 20-week EMA at $158.40 with much stronger resistance in the $160-$162 area.
The weekly relative performance made a new correction low last week as it was well below the lows that were made in October. It continues to indicate that this is not a market-leading sector. The RS line would need a strong move above its downtrend, line e, to turn positive.
The volume has been quite heavy over the past two weeks, and while the OBV has turned up, it is still well below its WMA The OBV has more important support at line f. The daily OBV (not shown) has moved back above its WMA as has the Dow Industrials A/D line.
Nasdaq-100
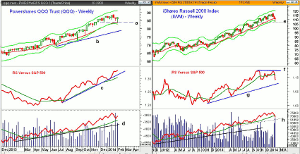
It was an impressive week for the PowerShares QQQ Trust (QQQ) as it dropped down to a low of $83.74 on Wednesday and then formed a doji. Therefore an HCD buy signal was triggered on Thursday as it closed well above its 20-day EMA, which is now at $86.29.
There is next resistance at $87.60 to $88.50 with the monthly projected pivot resistance at $90.92. The chart shows first support at $85.40 and then at $84.09 (line a), which is the quarterly pivot.
The weekly relative performance continues to act strong as it made a new high again this week. It continues to be a market-leading sector. The RS line still shows a strong uptrend, line c.
The weekly on-balance volume (OBV) has turned up as it has held well above its rising WMA during the correction. The daily OBV does look weaker as it is has stayed below its WMA.
The Nasdaq 100 A/D line has rallied sharply from the late-January lows and is back above its WMA. It is still below the key resistance that connects the December and January highs.
Russell 2000
The iShares Russell 2000 Index (IWM) spiked to a low of $107.27 last week, which was just above the November low, line e, at $107.14. The weekly starc- band was violated as it is now at $107.37.
The rebound last week was not as impressive in the IWM as it is still well below its quarterly pivot at $111.44. The flattening 20-day EMA is at $112.16 with further resistance in the $113.60-$114 area.
The relative performance formed a negative divergence at the recent highs, line f, and dropped sharply over the past two weeks. It is now well below its flat WMA but still above the longer-term support at line g.
The weekly OBV dropped a bit further below its WMA last week but did make a marginal new high with prices last month. The OBV is still well above the next support at line h.
The daily Russell 2000 A/D line is trying to turn up but has not been impressive on the rebound.
NEXT PAGE: Sector Focus, Commodities, and Tom's Outlook
|pagebreak|Sector Focus
The iShares Dow Jones Transportation (IYT) was hit hard early in the week as it dropped below the quarterly pivot at $126.18, making a low of $125.50 before rebounding. It closed on Friday just below its flat 20-day EMA.
A daily close back above the $131.50 area is needed to indicate that the correction is over and to set the stage for a test of the $134-$135 area. IYT is still down about 1.6% for the year but is one of the better-performing sectors. The daily studies have not given strong new buy signals.
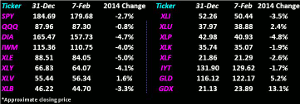
For 2014, the gold ETFs along with the Select SPDR Health Care (XLV) and the Select SPDR Utilities (XLU) are in positive territory for the year. The XLV is up 1.6% while the XLU has gained 2.4%.
There has been some improvement with the higher close as the Spyder Trust (SPY) is now down about 2.7%, while the SPDR Dow Industrials (DIA) is still the weakest, down 4.7%.
The PowerShares QQQ Trust (QQQ) is now down less than 1.0%, but the iShares Russell 2000 Index (IWM) is weaker as it is now down 4.0%.
The Select SPDR Energy (XLE) has continued to act poorly as it is down 5% despite the strong action in crude oil. The Select SPDR Consumer Discretionary (XLY) is doing only slightly better as it is down 4.8%.
Over the weekend, I will take a look at the support levels I outlined in Where Will Strong Sectors Find Support? to see if the levels held.
Crude Oil
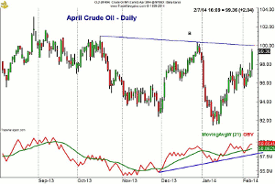
Crude oil was strong on Friday and closed the week up over $2.60 per barrel. The daily chart of the April contract shows that it is now getting quite close to the resistance in the $100 area, line a. A strong close above this level on good volume will suggest that the seasonal bottom is in place. The OBV is positive but has not yet broken out to the upside.
Precious Metals
The SPDR Gold Trust (GLD) and Market Vectors Gold Miners (GDX) are continuing to hold up well, which suggests we may not get a deeper correction before the uptrend resumes. I still like the GDX the best. Look for a Tweeted recommendation before the opening on Monday.
The Week Ahead
As I noted last week, the volatility does its best to “scare the individual investors out of the market or keep them from getting in at all.” It obviously got even worse early last week, and the strong rebound, along with the higher weekly close in most of the major averages, has likely caused additional confusion.
The correction has fulfilled many of the requirements that I had for a correction but there are still some missing ingredients. One strong down day and some bad news or data could trigger another wave of nervous selling and a drop below last week’s lows would set the stage for a more typical bottom formation.
A further drop would probably take the Euro ETFs and possibly the Japanese ETF that I recommended down to their buying zones. There are quite a few stocks that are looking more bullish, but I would still wait a bit longer for more positive signs before I become an aggressive buyer.
The correction was a bit sharper than I expected so quite a few of the stops in the model portfolio were hit. It is too early to tell whether the stops were too tight or not but I will update the portfolio this week.
Those not in the market should have started their dollar cost averaging program in an S&P 500 tracking ETF over the past few weeks (A Path to Investing Success in 2014). Be sure to keep adding at regular intervals until you have made your full investment.
Don't forget to read Tom's latest Trading Lesson, The Most Powerful Pivot Level.
Editor’s Note: If you’d like to learn more about technical analysis, attend Tom Aspray’s workshop at The Traders Expo New York, February 16-18, 2014. You can sign up here, it’s free.

