
The US stock market correction is now underway, and futures, global markets, gold, and the dollar are on the move as well. A look at the charts may help investors predict what's ahead and spot new buying opportunities.
It has been a rough start to the week and selling early Tuesday has been heavy overseas. The E-mini S&P 500 futures plunged below 1300 in early trading, but a couple hours before the market open, they were trading well above the early lows.
Investors can often benefit from watching stock index futures since important turning points frequently occur in the futures markets before the US stock market opens. A correction was expected last week, however, and the key levels are still holding.
Gold surged to new highs in euro, as the spreading fears about Italy’s debt crisis hit the single currency hard. Clearly, skittish investors are once again jumping out of riskier assets.
Interestingly, the dollar was also higher on the day, but it is still locked in its trading range. Rates also dropped again, and the low-yielding Treasury market is seen as a safe haven.
The apparent impasse over the debt ceiling is also starting to weigh heavily on the markets. It is too bad that most of our representatives failed to take Econ 101, as many apparently are not worried about the real consequences of a debt default. Hopefully, both sides will come to their senses soon; otherwise, the Treasury market is unlikely to be a safe haven.
Technically, the decline in the stock market has not done any lasting damage, but the strength of the first rebound will be informative. The emerging markets, as well as gold and the dollar, will need to be watched closely as the week progresses.
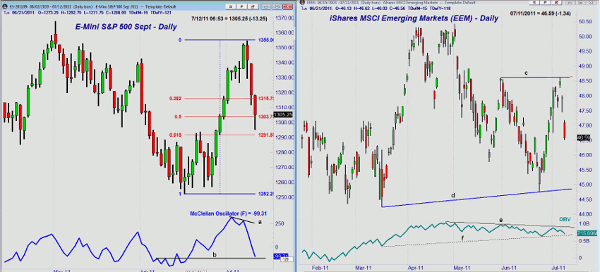
Click to Enlarge
Chart Analysis: The E-mini S&P 500 futures hit a low early Tuesday at 1295.25, which was below the 50% support level at 1303.70. So far, the futures are holding above the 61.8% support level at 1291.50.
- The sharp decline is likely to have reduced the too-high bullish sentiment, as it was a bit overwhelming late last week
- There is initial resistance now at 1311.75 and then at 1318.50. If Tuesday’s early lows hold, the 50% retracement resistance stands at 1325
- The McClellan Oscillator formed a short-term negative divergence last week, line a. This is consistent with a correction, but not the end of the rally
- The Oscillator has dropped from overbought levels above +250 to -99 on Monday. It is already back to oversold levels and support at line b
- The Arms Index hit 4.75 on Monday, which is typically an oversold extreme
- On a close below the 1291 level, a drop to the 1275-1285 area is likely
The iShares MSCI Emerging Markets (EEM) was also hit with selling Monday and is likely to be lower on Tuesday’s opening. There is next support in the $45.50-$46 area.
- A break below the stronger support at $44.25-$44.75 (line d) will suggest a decline to the $42.50-$43 area
- The daily on-balance volume (OBV) has formed lower highs (line e) with key support at line f. A drop below this support at the June lows would be negative
- There is initial resistance for EEM at $47.50 with major resistance at $48.60, line c
NEXT: Latest Chart Action for Gold and US Dollar
|pagebreak|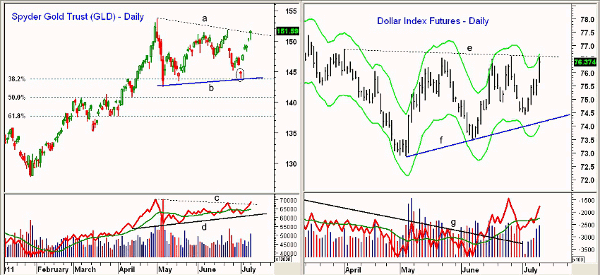
Click to Enlarge
The Spyder Gold Trust (GLD) has rallied impressively from the July 1 lows (see circle), as the 38.2% support was tested. GLD gapped higher the following day and has not looked back.
- Monday’s close was just above trend line resistance at line a. The daily Starc+ band (not shown) is now being tested. There is further resistance at the all-time highs at $153.61
- The 127.2% retracement resistance target is at $157, as is the weekly Starc+ band. The continuation pattern (lines a and b) has upside targets in the $159-$162 area
- Daily OBV has broken through resistance at line c, confirming the price action. The OBV held the support at line d on the recent decline
- The weekly and monthly OBV (not shown) have continued to confirm each new price high, keeping the long-term trend positive
- Minor support now stands at $150 and then in the $147.50-$148.50
The US dollar index futures were also strong on Monday, and despite the debt ceiling concerns, the dollar was favored over the euro. The trend line resistance at 76.60 is now being tested, as is the daily Starc+ band.
- The 50% retracement resistance is at 77.30 with the 61.8% resistance at 78.30
- The daily OBV broke its downtrend, line g, in June, and is starting to act stronger than prices
- The weekly OBV (not shown) did not form any bullish divergence at the lows
- There is initial support now at 75.20 to 75.70 with more important support at 74.40 and the July lows
- The trend line support is at 74.15 with the June lows at 73.50
What It Means: Though the correction in the US stock market has been faster than anticipated, the recent new high in the Advance/Decline (A/D) line continues to be a positive signal for the intermediate-term trend.
Nevertheless, the uptrends in the A/D lines for the NYSE, S&P, and Dow Industrials need to hold on a further correction. It is possible that we will see another panic low, but a more likely scenario is for an oversold bounce and then a test of the lows before the correction can be completed.
As for the emerging markets, many notable economists have made the case that in spite of all the global problems, emerging market growth prospects are better. There are no technical reasons to buy the iShares MSCI Emerging Markets (EEM) , but select country ETFs do look attractive.
The Spyder Gold Trust (GLD) looks ready to make significant new highs, though it may consolidate or pull back over the near term.
How to Profit: I continue to view the current market decline as a buying opportunity in individual stocks and sector ETFs. Many stocks, like these “Cash-Rich Companies with Strong Charts,” are holding up nicely.
Traders could look to buy GLD at $148.58 or better with a stop at $143.36 (risk of approx. 3.5%). I have no recommendation for the US dollar at this time.


