
Friday’s downturn should continue into next week, but technical analysis shows the sell-off should be much less painful than the last one, writes MoneyShow.com senior editor Tom Aspray.
It turned out to be another rollercoaster ride in the financial markets, as stocks powered higher leading into the monthly jobs report. In fact, the new bullish sentiment was a bit overwhelming.
Even though the ADP employment numbers on Thursday were much stronger than expected, Friday's jobs numbers were ugly.
Even though the major averages opened sharply lower, they did close well above the day’s lows. On days like Friday, you sometimes see a second wave of selling late in the day—which we did not get.
The other economic news was mixed, as while the ISM Non-Manufacturing Index was weaker than expected, the same-store sales data gave retail stocks a big boost on Thursday.
The key question now is whether we will see a brief pullback in the stock market, or whether a more prolonged correction is likely. In either case, as I discuss in more detail below, the new highs in the A/D line still paint a positive picture for stocks once the correction runs its course.
I was looking for rates to move higher last week, but instead both the short- and long-term US rates declined from the prior week. This was in spite of rate hikes by both the European Central Bank and the People's Bank of China. Many think this may be the last rate hike for the year in China, as its latest inflation data, released this week, is expected to top 6%.
Eurozone problems still played a role in global markets, as Moody’s surprise downgrade of Portugal’s debt caused a brief setback in the US stock market. The credit-rating firm's action was widely criticized by Euro bankers, as it was interpreted as a political move. Concerns over Ireland’s potentially higher debt costs also surfaced late in the week.
This is a big week on the data front, with earnings starting after the close Monday when Alcoa (AA) reports. Technically, AA’s stock does not look too hot, suggesting its numbers may be disappointing.
On Tuesday, we get the latest numbers on International Trade, as well as the release of the Federal Open Market Committee minutes. Import and export prices will be out Wednesday, and Bernanke is also testifying in front of the House Financial Services Committee that day. This may provoke some fireworks.
Thursday should be interesting, with retail sales, producer prices, and jobless claims all out at 8:30 a.m. Eastern time. Later in the day, we get a report on business inventories. The week ends with consumer prices, industrial production and consumer sentiment numbers, all on Friday.
Precious metals bottomed out last Monday and spent the rest of the week moving higher as gold and silver closed just below at strong resistance. Crude oil and most of the commodity markets moved higher and the broader commodity indices may have finally bottomed out.
NEXT: What to Watch
|pagebreak|WHAT TO WATCH
Stocks accelerated to the upside last Thursday, which was likely fueled by short covering ahead of the monthly jobs report. The ADP employment report clearly scared the short traders, as it suggested strong jobs numbers to follow on Friday.
Sentiment had seen quite a shift over the past month. The AAII survey of independent investors rose from just 24.4% bullish on June 9 to 41.7% on Thursday.
The sharply lower opening Friday does favor some follow-through selling early this week. It will likely take more sideways-to-lower trading in the major averages to dampen the too-high bullish sentiment. Friday’s drop was a start
There is a chance we will just get a two- or three-day pullback...but a six- to seven-day correction, like we saw in April, looks more likely. Here are some key levels to watch.
Click to Enlarge
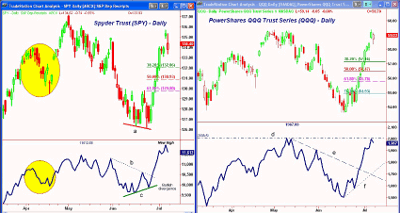
S&P 500
The Spyder Trust (SPY) gapped higher Thursday, clearly hitting some stops, and then gapped lower Friday, creating an island top. This formation has reliable intermediate-term significance, but over the short-term favors further weakness.
Minor support sits at $133.11, just below Friday’s low, with the 38.2% support level following at $132.03. The more important 50% support stands at $130.93, with key support now at $129.80.
There is resistance now at the gap from $134.25 to $134.88. Once above last week’s high at $135.70, there is next resistance at $136.11. Further resistance comes at $137.18 and the May highs.
The S&P 500 A/D line made convincing new highs last week before turning lower. The A/D line formed higher lows on June 23 (line c), while SPY made lower lows (line a). The move through the downtrend (line b) confirmed the bottom formation.
The A/D line needs to hold above its uptrend on a correction. We could see a similar correction in the SPY and the A/D as we saw in April (highlighted in yellow).
Dow Industrials
The Diamonds Trust (DIA) also formed an island top last week, with a high of $127.48. There is further resistance at $127.67, and then the May high at $128.63.
For DIA, the 38.2% support stands at $123.93, with the 50% support next at $122.83. A drop below $121.79 would be negative.
The Dow Industrials' A/D line was the strongest as the bottom was forming, and therefore it should hold up best on the correction. It also moved well above its May last week.
Nasdaq-100
The PowerShares QQQ Trust (QQQ) has an interesting chart, as it slightly exceeded the May highs (by five cents!) before filling Thursday’s gap on Friday. The close was well above the lows, which is an encouraging sign.
As I noted Friday, Amazon and Netflix—two Nasdaq bellwethers—were quite overbought, and I warned that a correction was overdue.
There is initial support now in the $58 area, with the 38.2% support to follow at $57.16. Given the better relative strength of the QQQ—it gained 10.6% from low to high, versus 7.5% for the SPY—the 50% support at $56.47 is expected to hold.
The A/D line on the Nasdaq-100 rallied sharply, but has not yet made new highs (line d). This is a minor divergence at this point, but does bear watching. The A/D line does show a sharp uptrend (line f), and the A/D line should hold above the downtrend (line e) on a correction.
Russell 2000
The iShares Russell 2000 Trust (IWM) did exceed its secondary May high at $85.54, with the peak at $86.41. The small caps held up surprisingly well on Friday.
There is initial support for IWM at $84.50 to $83.50, with the 38.2% support now at $82.66. The more important 50% support at $81.60 is expected to hold for now.
NEXT: Sector Focus, Commodities, and Tom's Outlook
|pagebreak|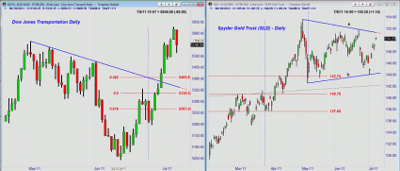
Click to Enlarge
Sector Focus
The rally over the past couple of weeks was fairly broad-based, but only a few market sectors have moved convincingly above the May highs.
Longtime readers know that I place quite a bit of emphasis on the Dow Transports, which have been leading the market higher since the 2009 lows.
The Transports' high last Thursday was 5,627, well above the May high of 5,565. Friday’s action looks much less severe on the chart of the Transports than it does on the S&P 500 or Dow Industrials.
There is first good support at 5,475, with the 38.2% support next at 5,405. Much more important chart and retracement support can be found in the 5,320 to 5,355 area.
Of the Select Sector Spyders I follow, only the Select Sector SPDR—Consumer Discretionary (XLY) was able to surpass its May highs last week. It had a high of $41.78, versus $40.88 in May.
From the June lows, XLY is up 11.7%, while theSelect Sector SPDR Financial (XLF) is up only 7.5%. The financial sector is trying to bottom, but still looks weak.
The Select Sector SPDR—Technology (XLK) did not make new highs last week, but was up 9.7% from the June lows to last Thursday’s highs. I will be taking a more detailed look at the sectors next week.
Oil
The August crude-oil contract also rallied sharply from the lows of $89.61. While the resistance at $96.50 was overcome, the rally has stalled below the downtrend that is currently at $100.66.
There has been some improvement in the technical studies, so it is possible that $89.61will hold. Initial support now sits at $94.40 to $92.72.
US Dollar
The bounce in the PowerShares DB US Dollar Index Bullish Fund (UUP) was anemic and the daily chart still shows an apparent continuation pattern.
It was slightly encouraging that the dollar held up well in spite of the ECB rate hike. Still, one more drop looks likely here, and that could help the commodity markets bottom out.
Gold
The SPDR Gold Trust (GLD) has rallied sharply from Monday’s low of $143.92, as GLD held above the 38.2% support at $143.74. This low now looks significant
The daily chart shows a broad flag formation (lines a and b). GLD gapped higher Friday, but is still below the resistance at $151.65.
I was looking for a deeper correction to the $140.70 area before the major uptrend resumes, but this now looks less likely. A pullback to the $147.50 to $147.80 area should be well supported.
Silver
The iShares Silver Trust (SLV) have also held up better than expected, as SLV has bounded from last week’s lows at $32.60. SLV did hold above the May lows at $31.97.
SLV is still in a broad trading range, with resistance now at $36.71 and then $37.72. A close above this level would be a plus.
The Week Ahead
Despite the heavy early selling on Friday, the market’s ability to close well off the lows is a positive sign. It could mean we will get a shorter and shallower correction.
I would look for a decline at least to the 38.2% support levels that I outlined above, and will be watching some of the short-term A/D indicators closely. They have turned down from overbought levels, and I would expect them to drop back to neutral levels before the correction is over.
As I noted earlier, rates did move lower last week, but I would look for them to hold above the recent lows and then turn higher. This would be a sign that more market participants are willing to accept more risk, which would be a positive for stocks.
Some of the stocks that I have discussed recently such as these "Cash-Rich Companies with Strong Charts" are still the ones I like.


