The daily and weekly charts for Freeport McMoRan Copper and Gold (FCX) show a flag formation, and a proven technical measure indicates that now is a low-risk time to buy the popular mining stock.
While fears about a new recession have grown, copper prices have dropped, and the Comex copper futures have declined by almost 16% from the early-August highs. The price of copper is now not far above the highs from early 2010, which is the next key support level.
Over the past few months, reports suggest that the Chinese are once again buying copper after cutting back their purchases early in the year. This week, copper prices in Shanghai have declined over European debt concerns and the belief that a lack of financing would limit new projects.
The clouded outlook for copper prices has certainly put pressure on Freeport McMoRan Copper & Gold, Inc. (FCX), which is down sharply from the July highs. The weekly and daily charts suggest that FCX is forming a bull flag formation, and despite the doom and gloom, it may be very close to a bottom.
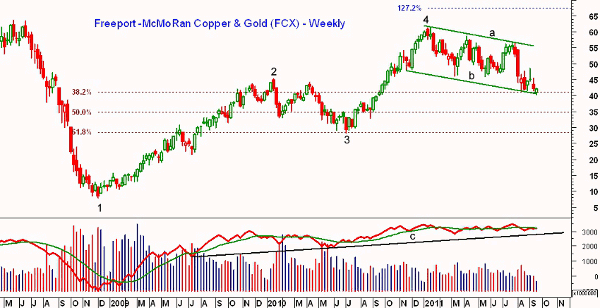
Chart Analysis: The long-term weekly chart shows the dramatic rally in FCX from the 2009 low at $7.85 (point 1). It rallied to a high of $45.27, point 2, in early 2010 before beginning a 20-month correction.
- The correction in 2010 represented a 37.4% decline from the highs, as FCX bottomed at $28.35 (point 3) in July 2010, just two months before the stock market bottomed out
- FCX doubled over the next six months, peaking at $61.34 in January 2011, point 4
- The weekly chart shows a broad flag formation, lines a and b, that has formed over the past eight months with FCX now testing the lower parallel support
- This also corresponds to the major 38.2% retracement support calculated from the bear market lows at point 1, which marks the early-2011 high (point 4)
- To this week’s low at $40.24, the decline has taken FCX 34.4% below the early-2011 highs
- The weekly on-balance volume (OBV) has been much stronger than prices and it is still well above its long-term uptrend, line c, and just barely below its weighted moving average (WMA)
- It is also positive that the OBV made new highs in July
- There is weekly resistance in the $45.50-$48.60 area
NEXT: See the Flag Pattern on the Daily Chart of FCX
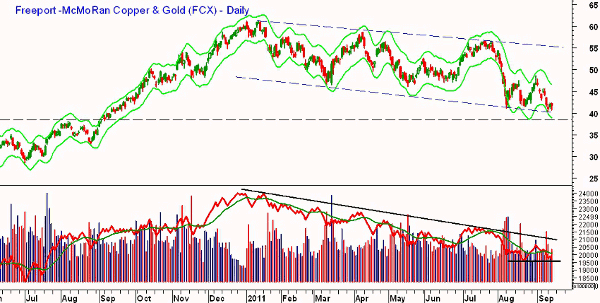
|pagebreak|The daily chart of FCX shows the continuation, or flag pattern, lines b and c, in more detail. The 61.8% retracement support from the 2010 lows is at $40.97, which was broken on Wednesday, although not on a closing basis.
- FCX is not far above the daily Starc- band at $38.90. There is also good chart support at $38.45, line c
- The first daily resistance is at $43-$43.60 with the daily Starc+ band at $46.60
- The upper boundary of the flag (line a) is at $55.30
- The daily OBV has been in a well-established downtrend since the early-2011 highs, line d
- While FCX has made lower lows over the past four weeks, the OBV has not yet made corresponding lows, line e
- As a result, a bullish divergence could be forming, but FCX needs a higher close on good volume to move back above its weighted moving average
What It Means: Those who have followed FCX know that it tends to turn up and down rather sharply. As I have discussed previously, flag formations are often completed by one last break to new lows.
The daily momentum studies like the Relative Strength Index (RSI) also show potential bullish divergences that have yet to be confirmed. The close proximity to the daily Starc- bands suggests that FCX is in a low-risk buying area.
How to Profit: Go 50% long Freeport McMoRan Copper & Gold, Inc. (FCX) at $41.12 and 50% long at $39.88 with a stop at $37.82 (risk of approx. 6.6%). On a move above $45, raise the stop to $39.88.
Alternatively, experienced option traders could buy a bull call spread such as the November 41/45. That means buying the November 41 call and selling the November 45 call, which closed at a debit of $1.84.


