Rising interest and stock valuations have dampened investor enthusiasm for homebuilder stocks since their May highs, and MoneyShow's Tom Aspray wonders whether associated stocks such as those of these home improvement chains will get hammered next.
Even though the Dow Industrials and the S&P 500 were down less than 0.5% on Wednesday, the drop in stocks this week has gotten quite a bit of attention. For the major averages, the decline has just taken them back to minor support at their still rising 20-day EMAs.
There has been further deterioration in the market internals as the NYSE Advance/Decline has dropped below the late July lows and is now in a short-term downtrend. As I discussed yesterday, the majority of the daily technical studies have not yet turned negative.
The futures are higher this morning, and I would look for a range to develop over the near term but it is also possible that the market is building a top that will eventually result in a deeper correction. Some sectors were hit much harder Wednesday as the Philadelphia Housing Sector (HGX) was down over 2% and most of the homebuilders are down sharply from their spring highs.
Will the two large home improvement stocks, Home Depot, Inc. (HD) and Lowe's Companies Inc. (LOW) now also see heavy selling?
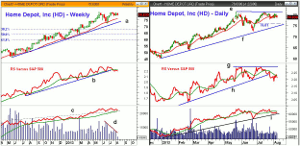
Chart Analysis: Home Depot, Inc. (HD) had an all-time high in May at $81.56 and last week's high was just $80.50. HD dropped 1.8% on Wednesday.
- The low of the past five weeks is at $77.89 and stops
are likely under this level.
- The rising 20-week EMA is now at $76.08 with the
weekly uptrend, line a, at $73.30.
- HD had a low at $46.37 in May 2012 and the 38.2% Fibonacci retracement support is at $67.85.
- The relative performance broke its weekly uptrend,
line b, in the middle of July and tested its flat WMA last week.
- The OBV made marginal new highs in July and is
holding just above its breakout level (line c) and its WMA.
- The volume has been declining over the past seven
weeks, line d.
The daily chart of Home Depot, Inc. (HD) shows a potential double top, line e.
- The quarterly pivot is at $76.81, which is just above the
uptrend, line f, at $74.70.
- A close below the June low at $72.41 would complete
the double top formation.
- The daily relative performance also shows double
peaks with resistance at line g.
- The RS line's daily uptrend, line h, was broken on
July 25 and the June lows were subsequently broken.
- This is a negative development and indicates that
prices may follow.
- The daily OBV is now below its WMA and just slightly above the
support at line i.
- There is initial resistance now in the $79.50-$80
area.
NEXT PAGE: What It Means
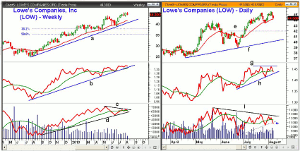
|pagebreak|Lowe's Companies, Inc. (LOW) did make a new high Tuesday at $45.46 and now has weekly support at $43.38.
- The rising 20-week EMA is at $41.63 with the weekly
uptrend, line a, at $40.61.
- The August 2012 low was $24.76 and the 38.2%
Fibonacci support is at $37.44 with the 50% support at $35.
- The weekly relative performance just made marginal new highs
with prices and is quite close to support, line b, and its WMA.
- The weekly OBV has formed a negative divergence at
the recent highs, line c, and is very close to dropping below its WMA.
- A break of the uptrend (line d) and a drop below the
June low will confirm a top.
The daily chart of Lowe's Companies, Inc. (LOW) shows a potential short-term double top and dropped back to its WMA on Wednesday.
- There is next daily support at $43.38 with more
important at $42, line e.
- The daily uptrend, line f, and the quarterly pivot is
at $40.68.
- The daily relative performance may also be forming a
double top, line g, with important support now at line h.
- The daily OBV made its high in May but then formed
lower highs in June and July, line i.
- The OBV has now broken its uptrend, line j (see
arrow).
- This longer-term negative divergence is in agreement with the weekly divergence so the multiple time frame OBV analysis is acting toppy.
- There is near-term resistance now at $45-$45.46.
What it Means: Of these two key home improvement stocks, Lowe's Companies, Inc. (LOW) looks the weakest. Both stocks bottomed out ahead of the homebuilders, and many are wondering when or where the homebuilding stocks will bottom out.
Later today, I will be releasing a review of my outlook for the homebuilding stocks (If you would like to receive a copy of this trading lesson, please sign up here).
How to Profit: No new recommendation.


