While most analysts' attentions are fully focused on the market's reaction to tomorrow's FOMC meeting, MoneyShow's Tom Aspray zeroes in on the downwards movement of a market sector that might otherwise be overlooked.
Stocks started off the week on a strong note, though, despite the sharply higher close, the market internals did deteriorate as the day progressed, closing about 2-1 positive. The Euro markets had impressive gains Monday, but are quiet in early trading, as are the US futures.
The rally has not yet resolved the patterns of deterioration that I have been noting over the past several weeks. This does not mean that the rally cannot go further over the near term, but it does suggest the rally is likely to ultimately fail. The sentiment is still too bullish and the Put/Call ratios do not reflect a high level of bearishness. The close on Wednesday is likely to resolve the short-term outlook.
The market's next major move is likely to come after the FOMC announcement on Wednesday afternoon, but it is not clear that a decision not to taper will be bullish for stocks, or that a decision to taper is going to necessarily be bearish. I still do not expect the Fed to act because of deflationary fears.
As I pointed out in early December, the health care sector appeared to have completed a short-term top, and the Sector Select Heath Care (XLV) is now down 3.2% from the late November highs. It is likely to take a further decline, to reduce the too high bullish sentiment.
There are now some similar warnings for the high-flying biotechnology sector, as key ETFs like the iShares Nasdaq Biotechnology (IBB), appear to have completed near term tops. It is still up 57.9% for the year, and like heath care, it too should make further new highs in 2014.
So how far could these biotech stocks and the key ETFs decline?
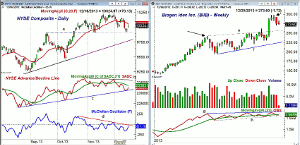
Chart Analysis : The daily chart of the NYSE Composite (NYA) shows Monday's 0.70% gain as it rallied after coming close to the more important support in the 9900 area, line a.
- Monday's high was close to the declining 20-day EMA
at 10,063, with even stronger resistance in the 10,100 to 10,160 area.
- The NYSE Advance/Decline has turned up from long-term
support, line c, but is still below its declining WMA.
- The A/D line formed negative divergences at the
recent highs, line b, and broke support in early December.
- The McClellan oscillator peaked in September and has
since formed lower highs, line d.
- There is next resistance at the zero line and then in
the +40 area.
- On a break of the 9900 level, the longer term uptrend
and more important support is in the 9700-9750 area.
- The fourth quarter pivot is at 9558.
Biogen Idec, Inc. (BIIB) is a $64.6 billion biotech giant, which had a weekly doji high at $298.82 in November.
- The low close doji sell signal was triggered last week
and a similar sell signal was generated last May, (see arrow).
- In May, BIIB lost 19.7% from high to low, in a correction
that lasted nineteen days.
- Currently, BIIB has been declining for ten days from its highs.
- The rising 20-week EMA is at $251, which is about
8.2% below current levels.
- The monthly projected pivot is at $248.
- The relative performance (not shown) did confirm the
recent highs, but the daily RS line is below its WMA.
- The weekly OBV did make slight new highs with prices, line g,
but has now dropped below its WMA.
- A drop below more important support, at line h, would
be more negative.
- There is initial resistance at $286, with stronger at
$293.20.
NEXT PAGE: Two More Biotechs with Warning Signs
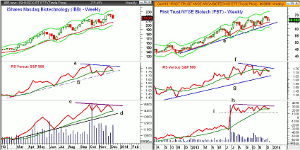
|pagebreak|iShares Nasdaq Biotechnology (IBB) has Net Assets of $4.38 billion, with over 8% in Biogen Idec Inc. (BIIB), Gilead Sciences Inc. (GILD), and Celgene Corp. (CELG).
- In November, IBB had a high of $225.10, and it is now down 4% from
the highs.
- The 20-day EMA is now at $206.40, with the weekly starc- band at $199.
- In November, the low was $197.44 as IBB tested its 20-week EMA.
- The weekly relative performance did not confirm the recent highs
as it has formed a two month negative divergence, line a.
- The RS line is still above its rising WMA and the
uptrend, line b.
- The weekly OBV also did not confirm the new highs as
it has formed lower highs, line c.
- The daily studies (not shown) also formed bearish
divergences at the highs and are below their WMAs.
- There is initial resistance at $219.50-$224.
First Trust NYSE Biotech (FBT) has total assets of $859 million and is up 43.8% so far, in 2013. It has just 20 stocks in its portfolio as compared to 118 in IBB.
- FBT is now close to its 20-week EMA at $64.65 with
the weekly uptrend at $63.
- In November, FBT had a low of $60.78, which is very close to the
weekly starc- band, and the October low was $59.09.
- The relative performance has formed sharply lower
highs, line f, and is now below its WMA.
- There is more important support for the RS at line g.
- The OBV failed to make new highs last month, line h,
and is now testing its WMA.
- The weekly OBV has important support at line i.
- The daily technical studies (not shown) are both
below their WMAs.
- There is first resistance now in the $67.75 to $68.37
area.
What it Means: Though the longer term outlook for health care and biotechnology is still positive, they are currently acting toppy.
For example, iShares Nasdaq Biotechnology (IBB) has reached is monthly starc+ band many times over the past nine months, which suggests it is a high-risk buy at current levels.
Therefore, if you have been long this sector for some time, taking some profits now or hedging part of your position is likely to be a good idea.
How to Profit: No new recommendation.


