Sticking with market-leading sectors and the stocks in those sectors can give your portfolio an edge over the broader index ETFs, says MoneyShow’s Tom Aspray, as he takes a technical look at this year’s market leaders.
The ECB did as promised on Thursday as they cut a key rate to below zero in a belated effort to counter the threat of deflation in the Eurozone. The German Dax made new all-time highs in Thursday’s session, led by the financial stocks, but closed well off the day’s highs.
The US markets set further new all-time highs, with the advancing issues on the NYSE Composite leading the declining issues by a 3-1 margin. All ten of the S&P sectors were higher at the end of the day, with the Russell 2000 small-cap index gaining 2%.
Hedge fund manager David Tepper, who spooked the markets last month because he was nervous about the markets, has changed his tune as his fears have been “alleviated.” This illustrates why one should never act based on any one expert’s opinion. The S&P 500 cash actually made its low the day after his comments and has now risen over 4% from those lows.
The Spyder Trust (SPY) is just one point below its weekly and daily starc+ band, with the monthly projected pivot resistance at $197.29. Clearly, buying the market averages at current levels has too high a risk even though the daily analysis indicates the SPY is trending.
In last Friday’s Week Ahead column, I discussed my bullish outlook for the stock market and recommended A Portfolio That Won’t Ruin Your Summer for those who were not in the market or who sold in May. I still like this approach while more aggressive investors should concentrate on stocks in the market-leading sectors. These four sector ETFs have been some of the best so far in 2014.
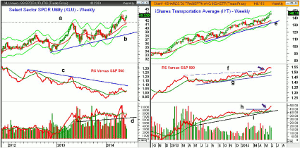
Chart Analysis: The Select Sector SPDR Utility (XLU) tested the uptrend from the late-2012 lows in late 2013 and then turned higher in early 2014.
- The XLU, as of Thursday’s close, is up close to 14% for the year as the 2013 highs, line a, were overcome in early April.
- The breakout level and the 20-day EMA were tested in May, and XLU is just below the year’s high at $43.52.
- The weekly starc+ band is at $44.29 with the monthly projected pivot resistance at $44.79.
- The completion of the weekly chart formation, lines a and b, has upside targets in the $47-$49 area.
- The relative performance completed its bottom formation in early 2014, and it is just barely above its rising WMA.
- The RS line is still below the longer-term downtrend, line c.
- The OBV surged to a sharp new high in April before dropping back below its WMA.
- The OBV support at line d appears to have held.
- There is minor support at $42.50 and the monthly pivot with the daily starc- band in the $42 area.
The iShares Transportation Average (IYT) has been a favorite since early in the year as my bullish outlook for the economy meant that this should be a strong sector. It is currently up 10.8% for the year.
- IYT is getting closer now to the weekly starc+ band at $149.11 with the projected monthly pivot resistance at $151.58.
- IYT has not closed below its 20-week EMA since August 2013.
- The declines back to the EMA have been good entry points and it is currently at $135.55.
- The relative performance broke out to the upside five weeks ago as resistance at line f was overcome (see arrow).
- The RS line has been in a solid uptrend, line g, since last summer.
- The weekly OBV also held long-term support, line i, in late April but did drop below its WMA.
- The OBV moved through short-term resistance, line h, on May 9.
- There is short-term support at $142.29 and the monthly pivot with the short-term 38.2% retracement support currently at $140.38.
NEXT PAGE: 2 More Market-Leading Sectors
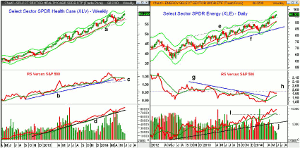
|pagebreak|The Select Sector SPDR Health Care (XLV) has been a market leader as it staged a major upside breakout in 2012. It is currently up 8.6% in 2014.
- XLV was up 41.4% in 2013 and 17.4% in 2012, easily beating the SPY in both years.
- The April close below its 20-week EMA was a good buying opportunity.
- The weekly starc+ band is at $61.60 with the projected monthly pivot resistance at $61.67.
- The early May high at $60.28 was just slightly exceeded in Thursday’s session.
- The relative performance has rebounded back to its declining WMA after breaking its uptrend, line b, in April.
- The RS line has more important support now at line c.
- The weekly OBV shows a strong long-term uptrend, line d, that goes back to late 2012.
- The OBV has made new highs over the past two weeks.
- There is initial support now in the $58.80-$59.20 area.
The Select Sector SPDR Energy (XLE) has also had a good year as it is up 8.5%. The weekly starc+ band was tested in late April, but instead of correcting, it just moved sideways.
- XLE was able to hold the breakout support at line e.
- The monthly projected pivot resistance is at $97.06 with the weekly starc+ band at $98.52.
- The relative performance broke its downtrend, line g, in early April, which was a positive sign.
- A move in the RS line above the resistance at line h would be even more positive.
- The weekly on-balance volume (OBV) moved above the late-2013 highs (line i) in early April.
- The OBV has been leading prices higher and is very close to making another new high.
- There is initial support in the $94.50 area, which corresponds to the 20-day EMA and monthly pivot.
- There is good weekly support now at $92.60-$93 with the weekly starc- band at $90.23.
What It Means: Sticking with the market-leading sectors and the stocks in those sectors can give your portfolio an edge over the broader index ETFs like the Spyder Trust, which is up 5.3% so far in 2014. They can also undergo more severe corrections, so it is best not to have too large a commitment to any one sector.
In the Charts in Play Portfolio, there are several other sector ETFs including; Select SPDR Materials (XLB), Select SPDR Consumer Discretionary (XLY), and the SPDR S&P Retail (XRT).
Our long position in the SPDR Oil & Gas Exploration (XOP) was stopped out as I was expecting a sharper correction and my stop turned out to be too tight.
The Select Sector SPDR Materials (XLB) broke out in February, and I am looking for new opportunities in this sector.
How to Profit: No new recommendation
Portfolio Update: Should be 50% long the SPDR S&P Retail (XRT) at $84.44 long and 50% at $83.58, with stop at $79.42 (correction from Charts in Play portfolio page).
Should be 100% long the Select SPDR Consumer Discretionary (XLY) at $63.92, with a stop at $62.16.
For Select Sector SPDR Materials (XLB), should be 50% at $47.08 with a stop at $45.69.
Also long the Select Sector SPDR Health Care (XLV) from $38.50 with a stop at $52.77.


