
Margin debt is one of the principal ways in which the mania has been funded; from the lows of the March 2020 crash, margin almost doubled from $479 billion to $936 billion, explains Alan Newman, market timing strategist and editor of CrossCurrents.
However, margin debt peaked six months ago, along with the broad market. Thus far, the decline in margin is modest — just 17.4% and $163 billion.
However, as the fallout from the tech mania bubble and housing/stock bubble strongly imply, margin debt should eventually contract by at least 50%-55% and $450 to $500 billion. Given our take that this could be a very long term bear market in progress, the draw down in margin debt could easily be worse.
Meanwhile, our nomination for "Chart of the Year" was initially presented in Greg Blaha’s monthly report on stock market capitalization of GDP by Bianco Research. The chart below shows the two year change in the stock market's capitalization as a percentage of nominal GDP.
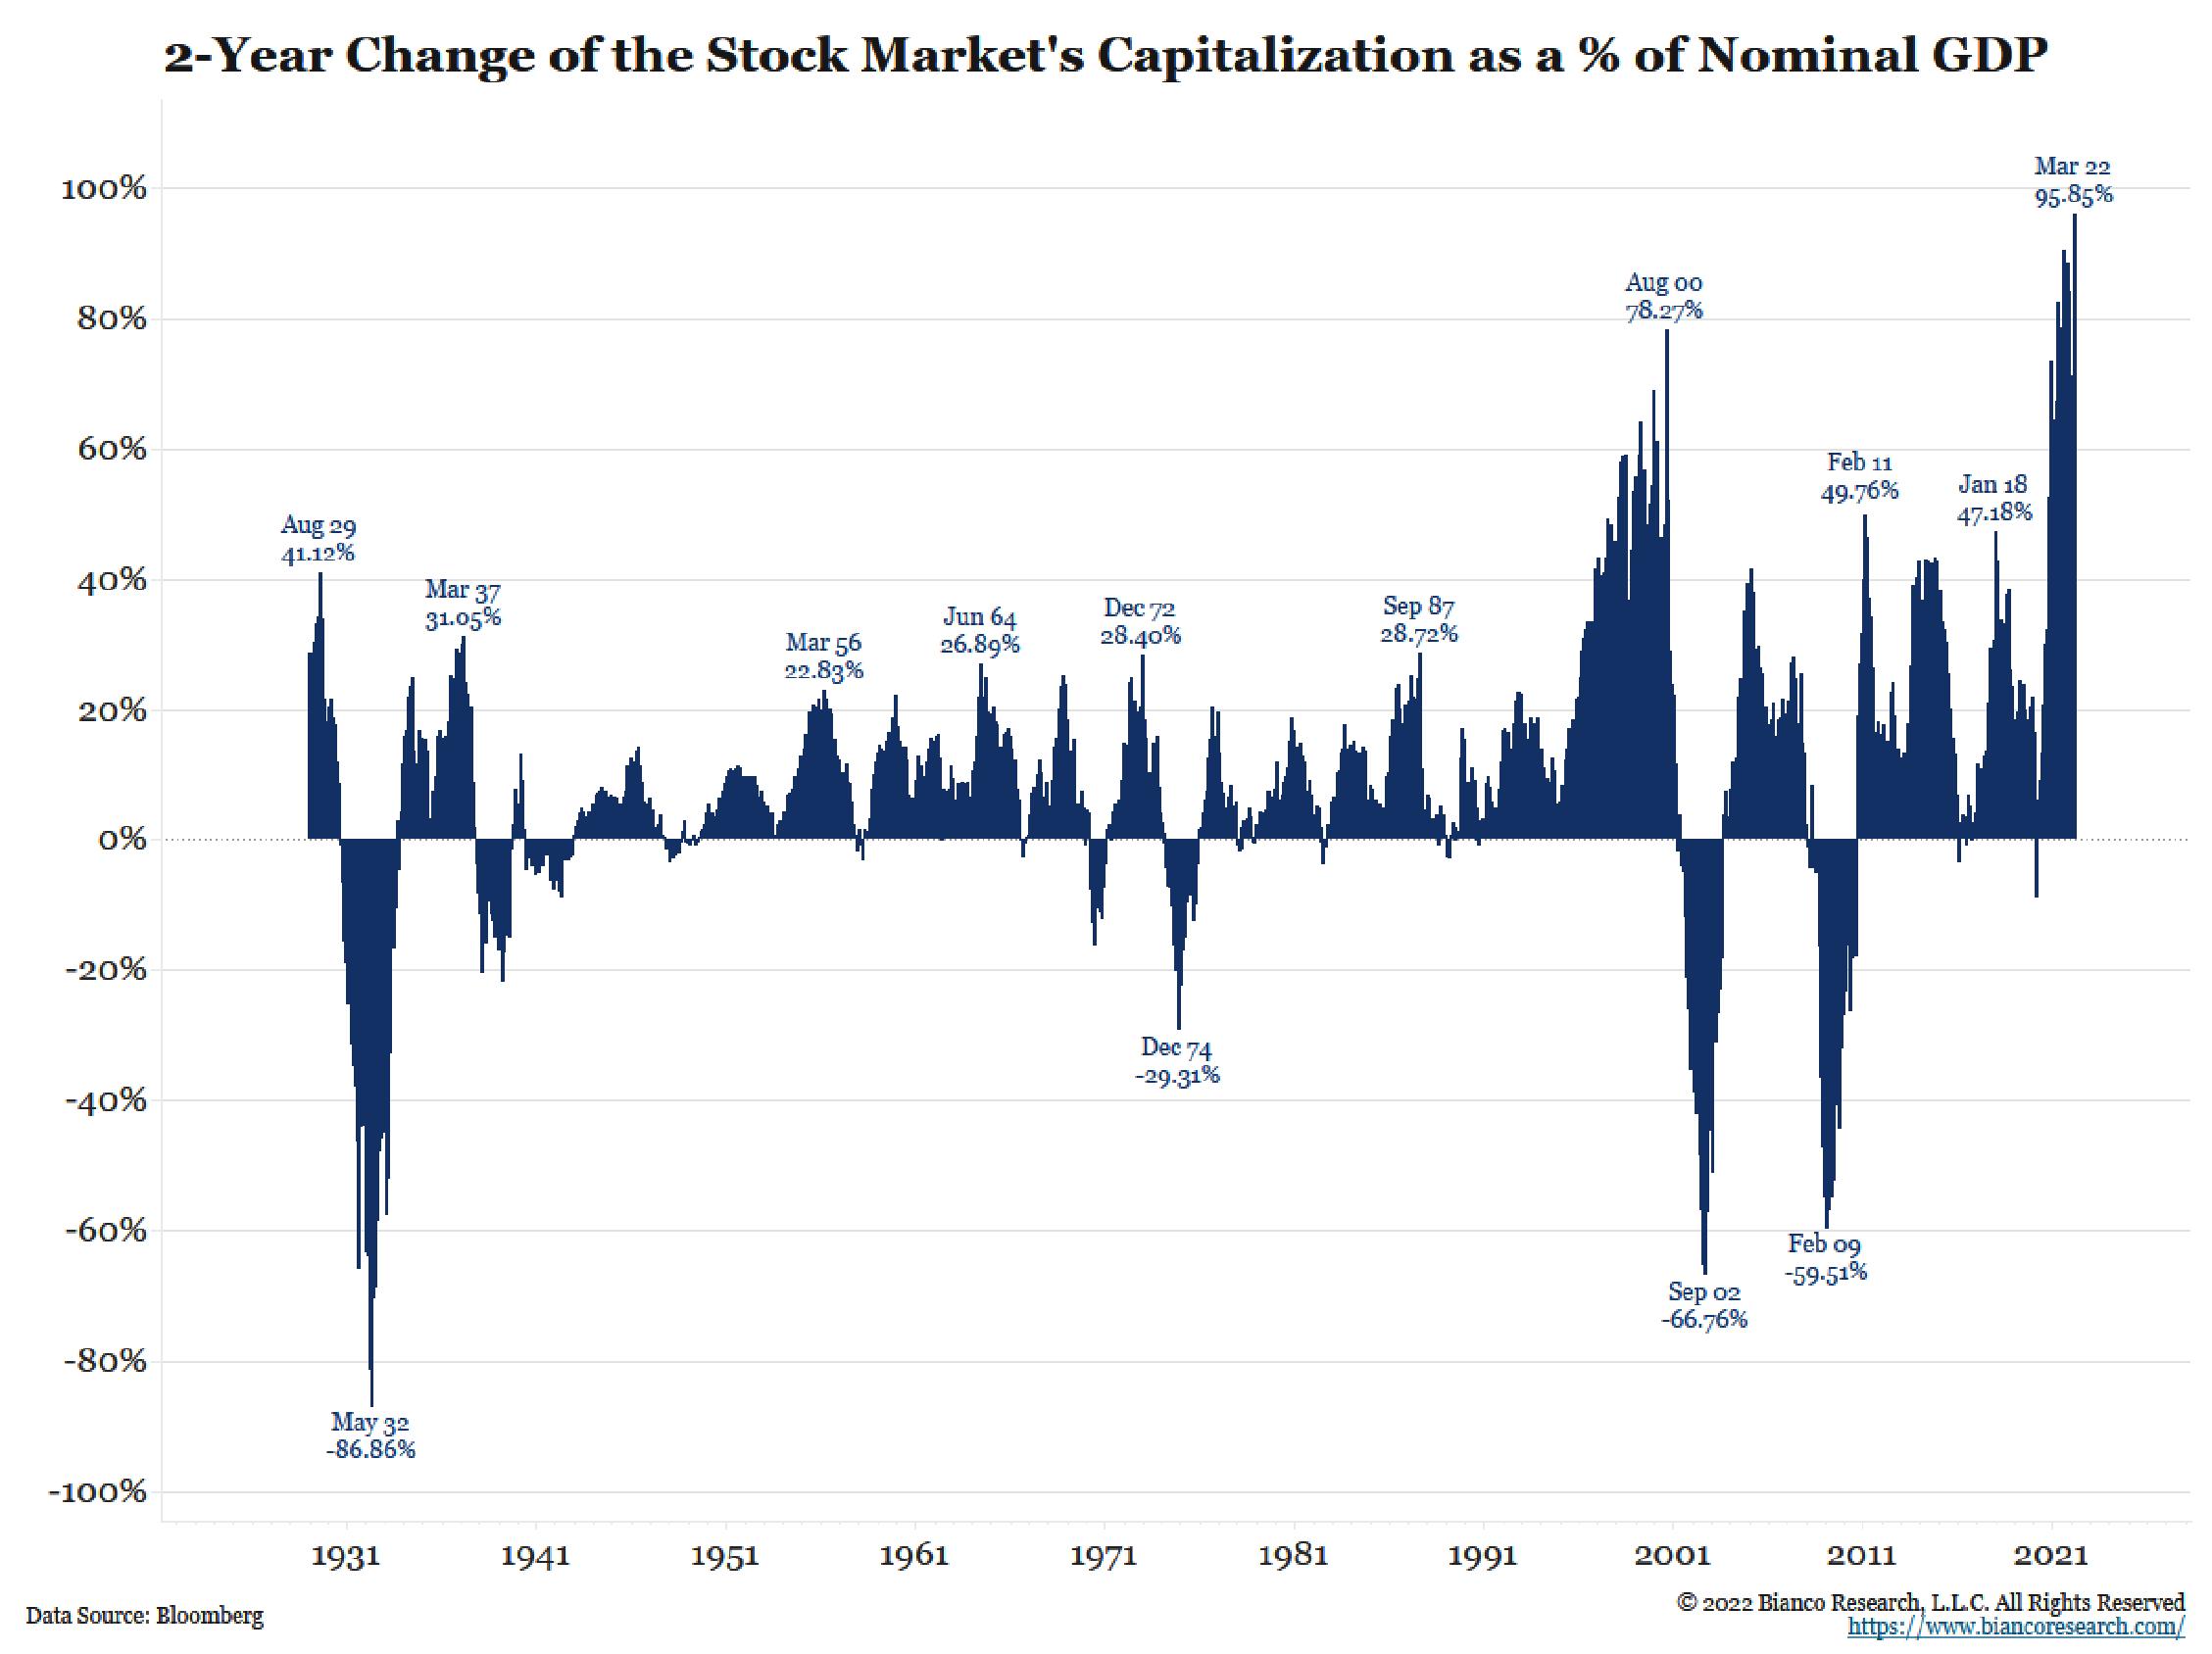
We’ve blown this picture up as much as possible to highlight all details. One can immediately see some obvious reversals, like the peaks of December 1972 and September 1987. In the case of the former, stock prices were cut in half over the next two years and in the case of the latter, prices crashed 36% in one day.
There is more than adequate proof of previous stock manias, like the Roaring Twenties of the last century when this measure topped at 41.12% and the tech mania in 2000 when a new record of 78.27% was established.
However, every peak pales beside the record achieved just a couple of months ago when the two year change came in at 95.85% of nominal GDP. We have repeatedly made the case for horrifically lower stock prices; in fact, we have maintained a long term target of Dow 14,719, which would be down 60.2% from the January 5th print high of Dow 36,952.
Frankly, we’ve received quite a few puzzled inquiries about our long term target over the last couple of years, particularly as the major averages continued to advance to new record highs. However, our target seems quite reasonable to our critical eye.
The four biggest bear markets over the life-time of this chart bottomed out in 1932, 1974, 2003 and 2009, down 86.86%, 29.31%, 66.76% and 59.51% respectively.
The average of the four declines is 60.61%, corresponding almost exactly with our previously mentioned long term target of Dow 14,719, down 60.2% from the January peak. We’re not puzzled at all.


